Diagrams as code, with a local studio

diagc turns diagram sources in your repository into self-contained pages and pictures, and gives you a browser studio to draw them.

curl -fsSL https://raw.githubusercontent.com/Ferroman/diagc/main/install.sh | sh

macOS and Linux, no Node required. With Node 22 or newer: npm i -g @diagc/cli.

Open a live demo Read the tutorial

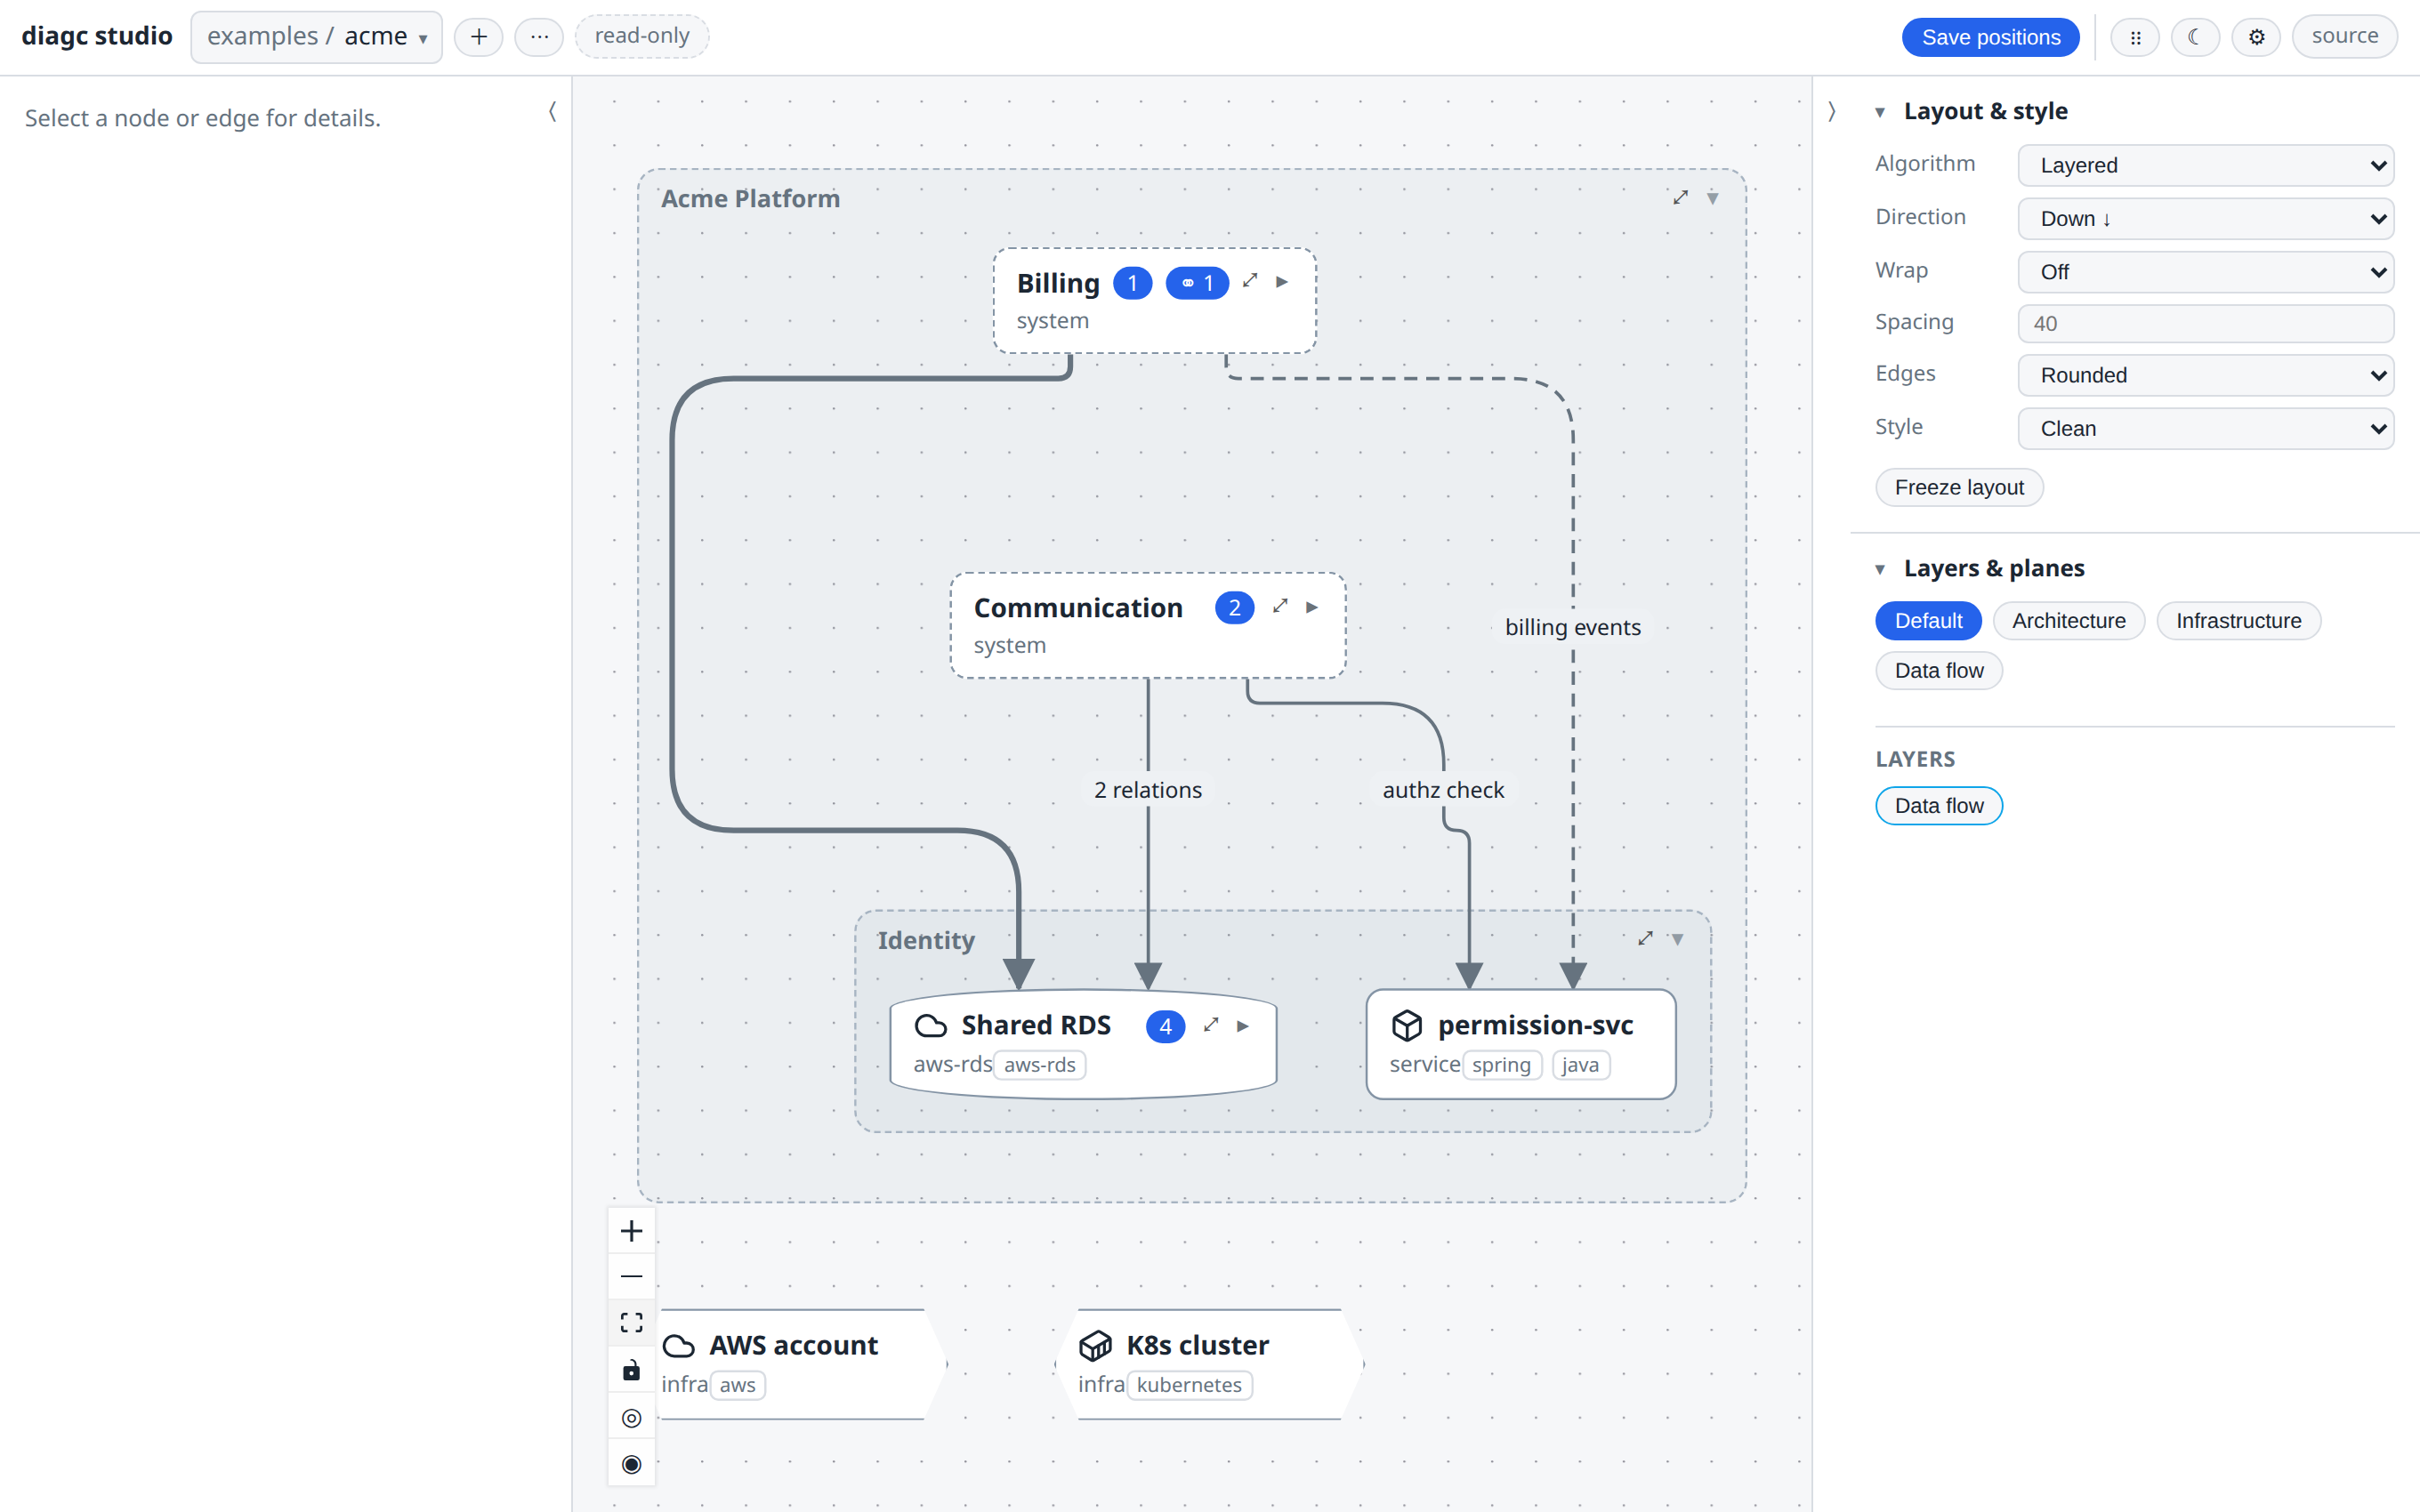
diagc studio
The diagc studio: a platform diagram with one system unfolded and the others folded

Features

Pages and pictures

diagc publish writes one self-contained HTML page per diagram, and a PNG. The page folds, zooms and switches views in the browser, with no server behind it.

Host the pages on GitHub Pages, GitLab Pages or any static host. Put the PNG in a README.

  • .diagrams/html/<name>.html one file, with everything inlined
  • .diagrams/html/index.html an index of all the pages
  • .diagrams/static/<name>.png a picture to commit
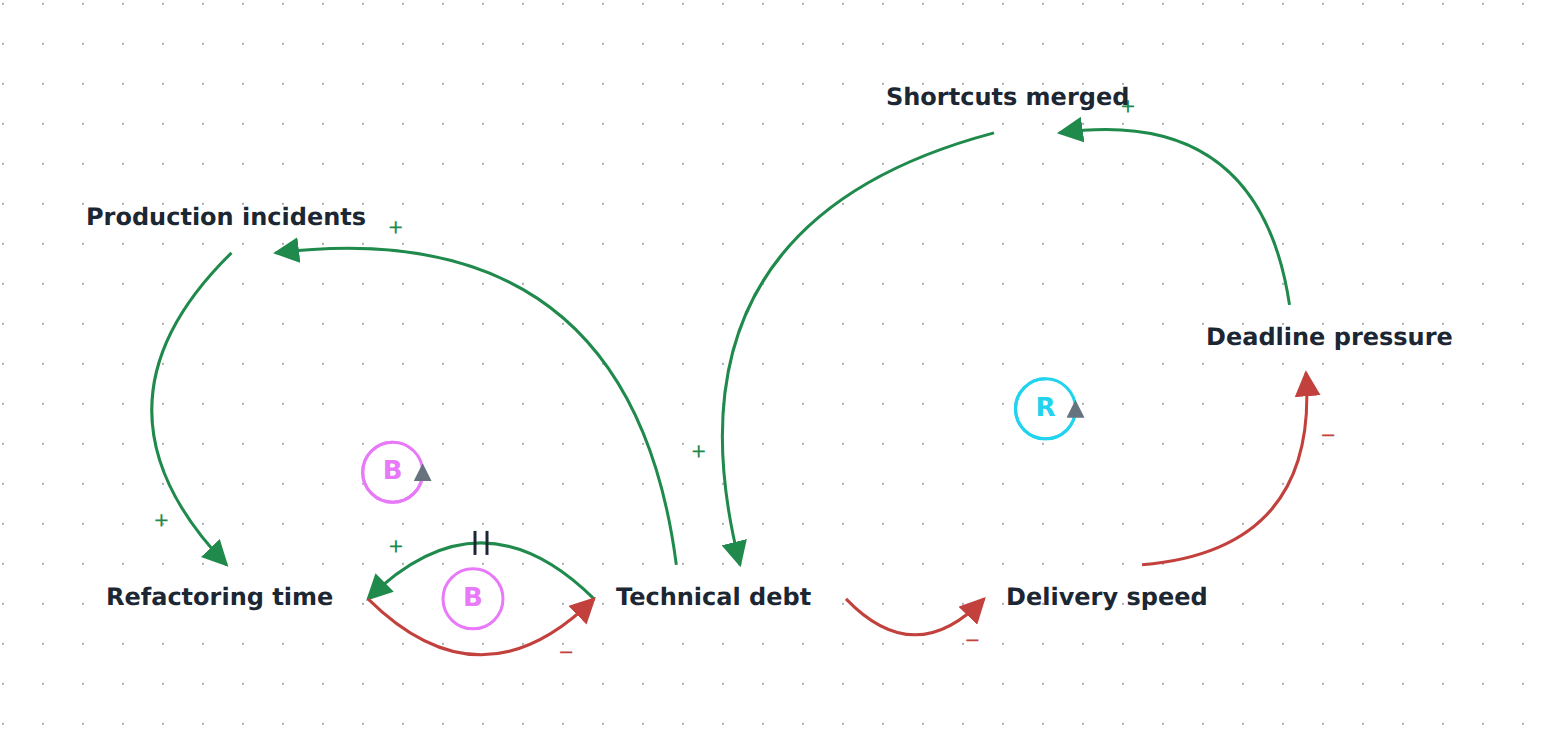
A causal-loop diagram about technical debt, as the PNG that publish writes

Publish and share

A local studio

diagc studio opens a browser app against your repository. Draw a diagram there and the studio saves it as a file in the repository. diagc eject turns a drawn diagram into TypeScript.

It runs on your machine against your files: no accounts and no server.

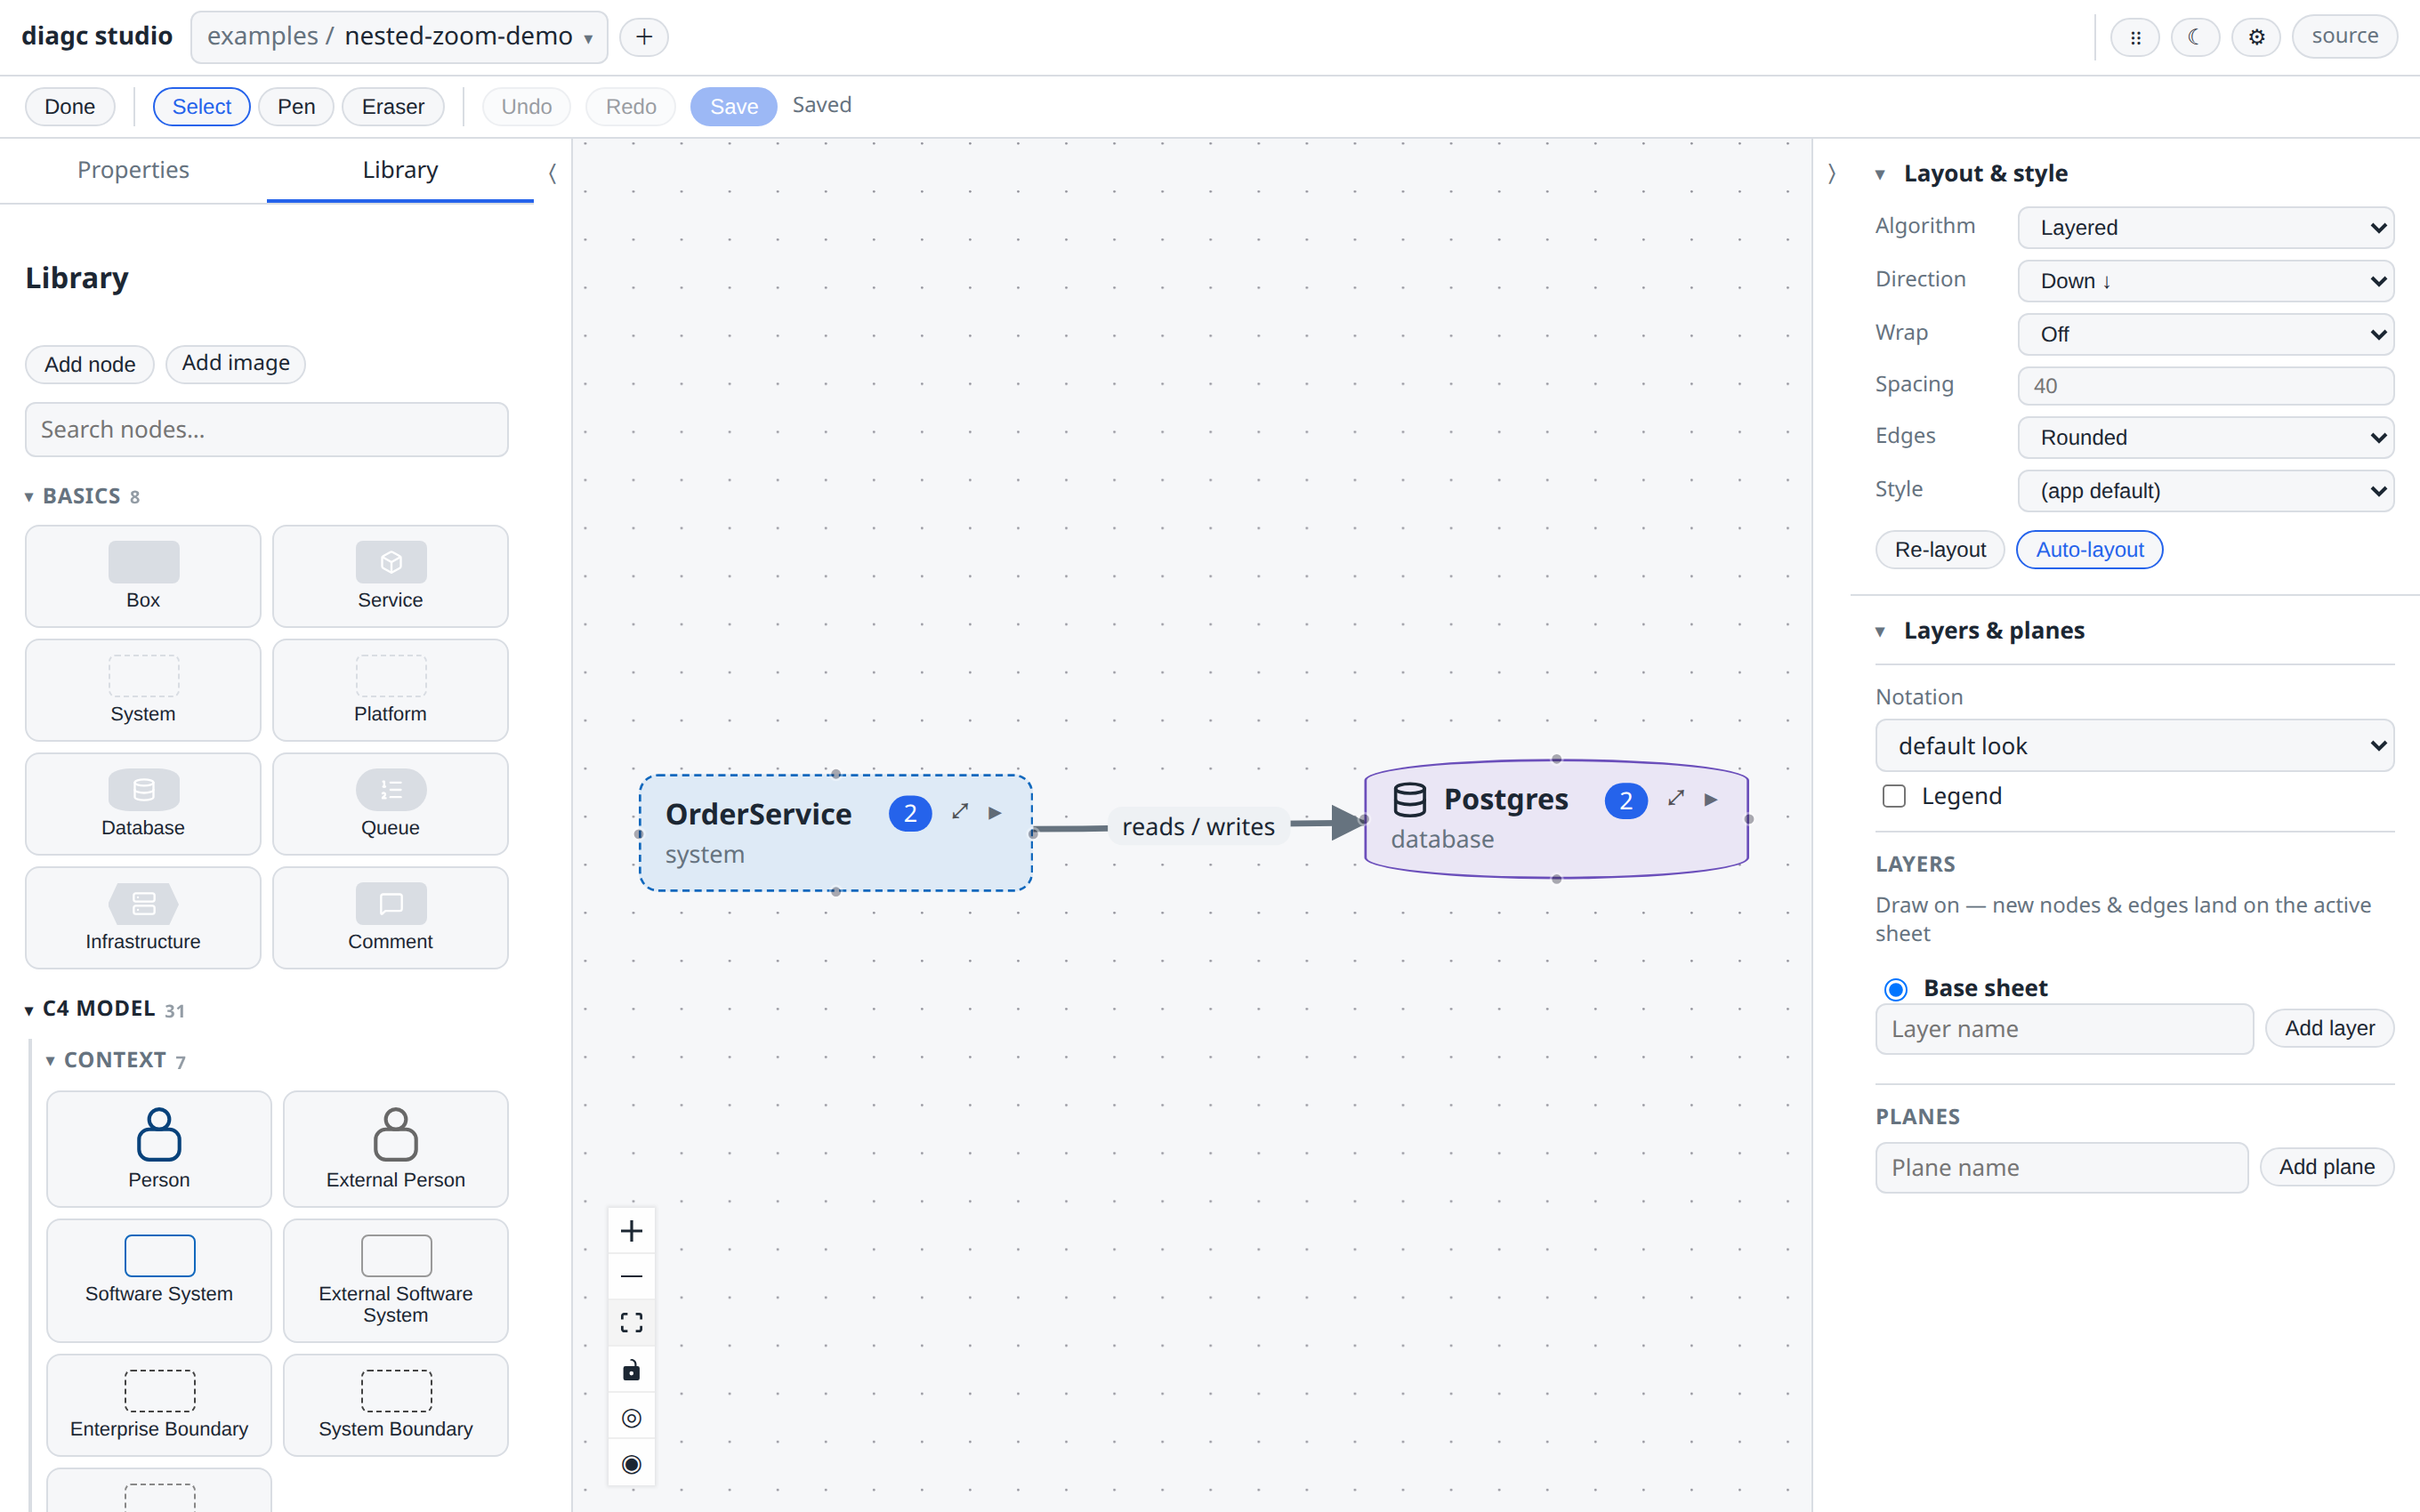
The studio in edit mode, with the icon library open beside the canvas

Draw one in the browser

Diagrams as code

A diagram is a TypeScript file, so it diffs, reviews and refactors like the rest of your repository. diagc lint reports what compiles but is probably a mistake.

Author diagrams in TypeScript

Code generation

Draw a diagram in the studio, then eject it. diagc eject replaces the drawing with a generated TypeScript source that rebuilds exactly the same model.

Eject a diagram to TypeScript

AI-written diagrams

Ask a coding agent for a diagram, and it writes the source and checks its own work. diagc guide tells it how, and diagc init --agents points it there.

Write diagrams with a coding agent

Semantic zoom

A diagram rests as folded groups whose relations aggregate. Start from the big picture and double-click a group to open it.

Organise a large diagram

Planes and layers

A plane groups the same things in a second way: by system in one view, by where they run in another. A layer adds detail without cluttering the base picture.

Use planes and layers

Composition

include combines diagrams from several sources, so each system appears in the context of the others without copy-paste.

Compose diagrams

Multiple diagram types

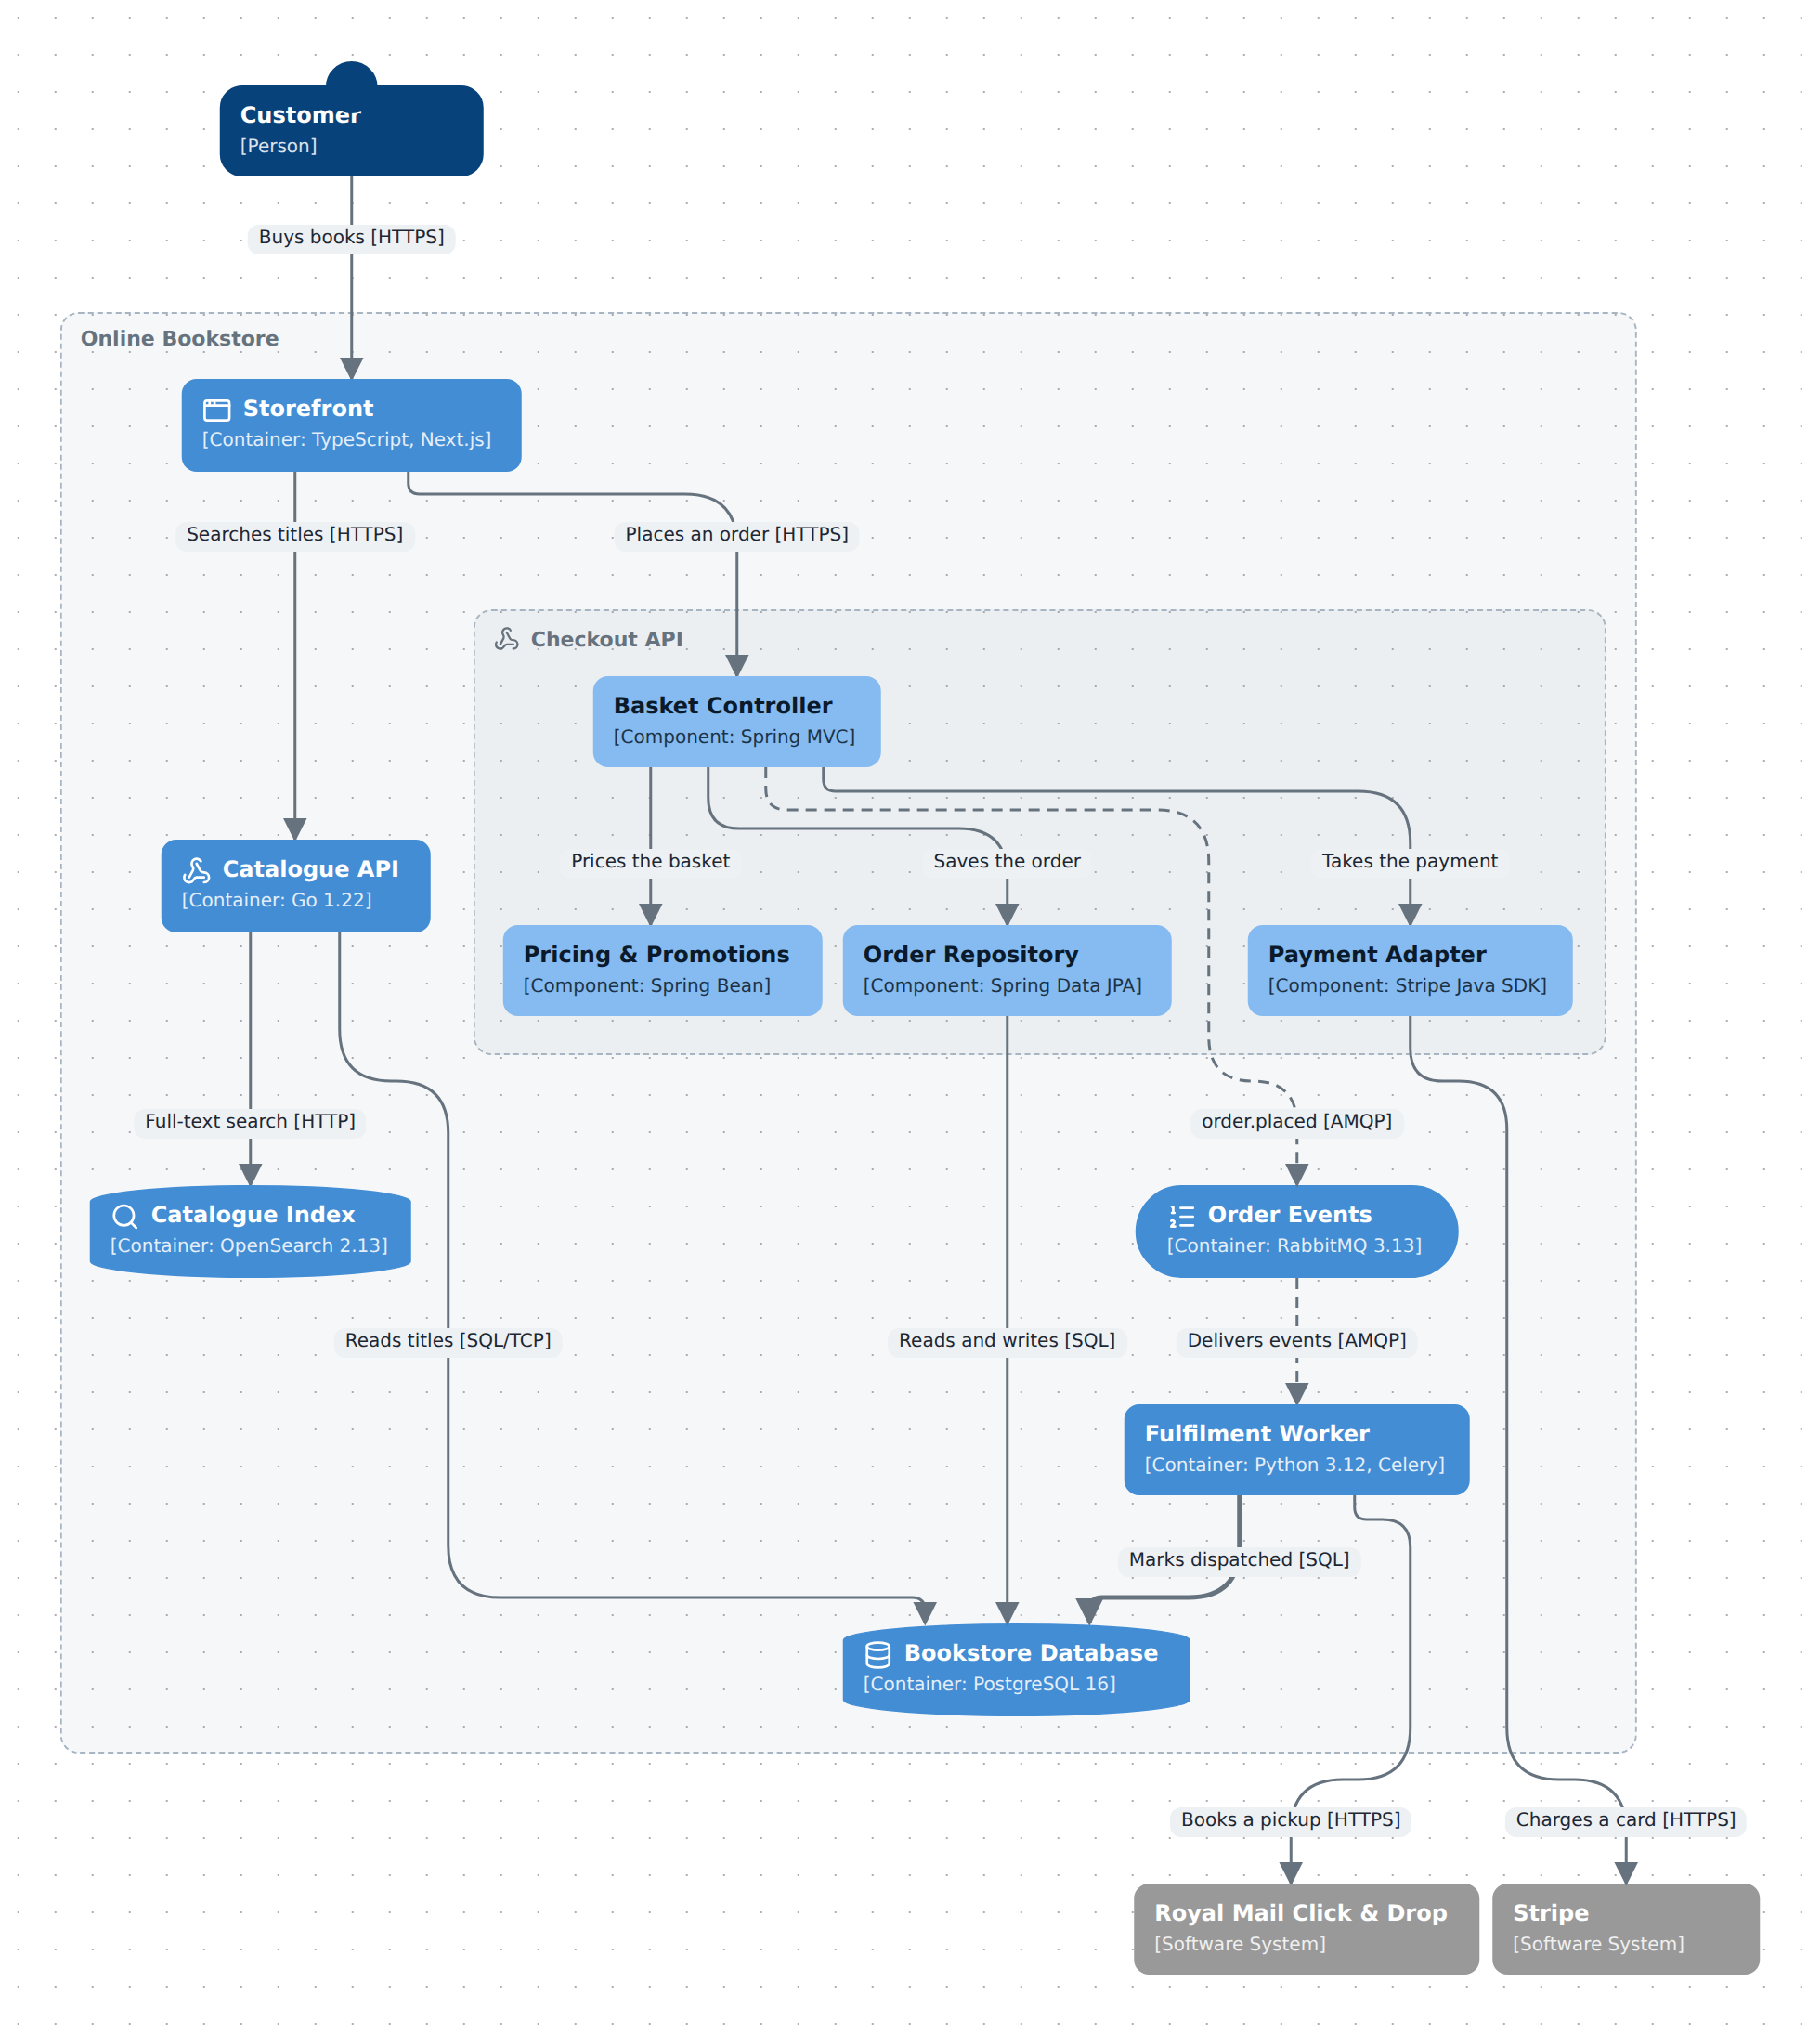
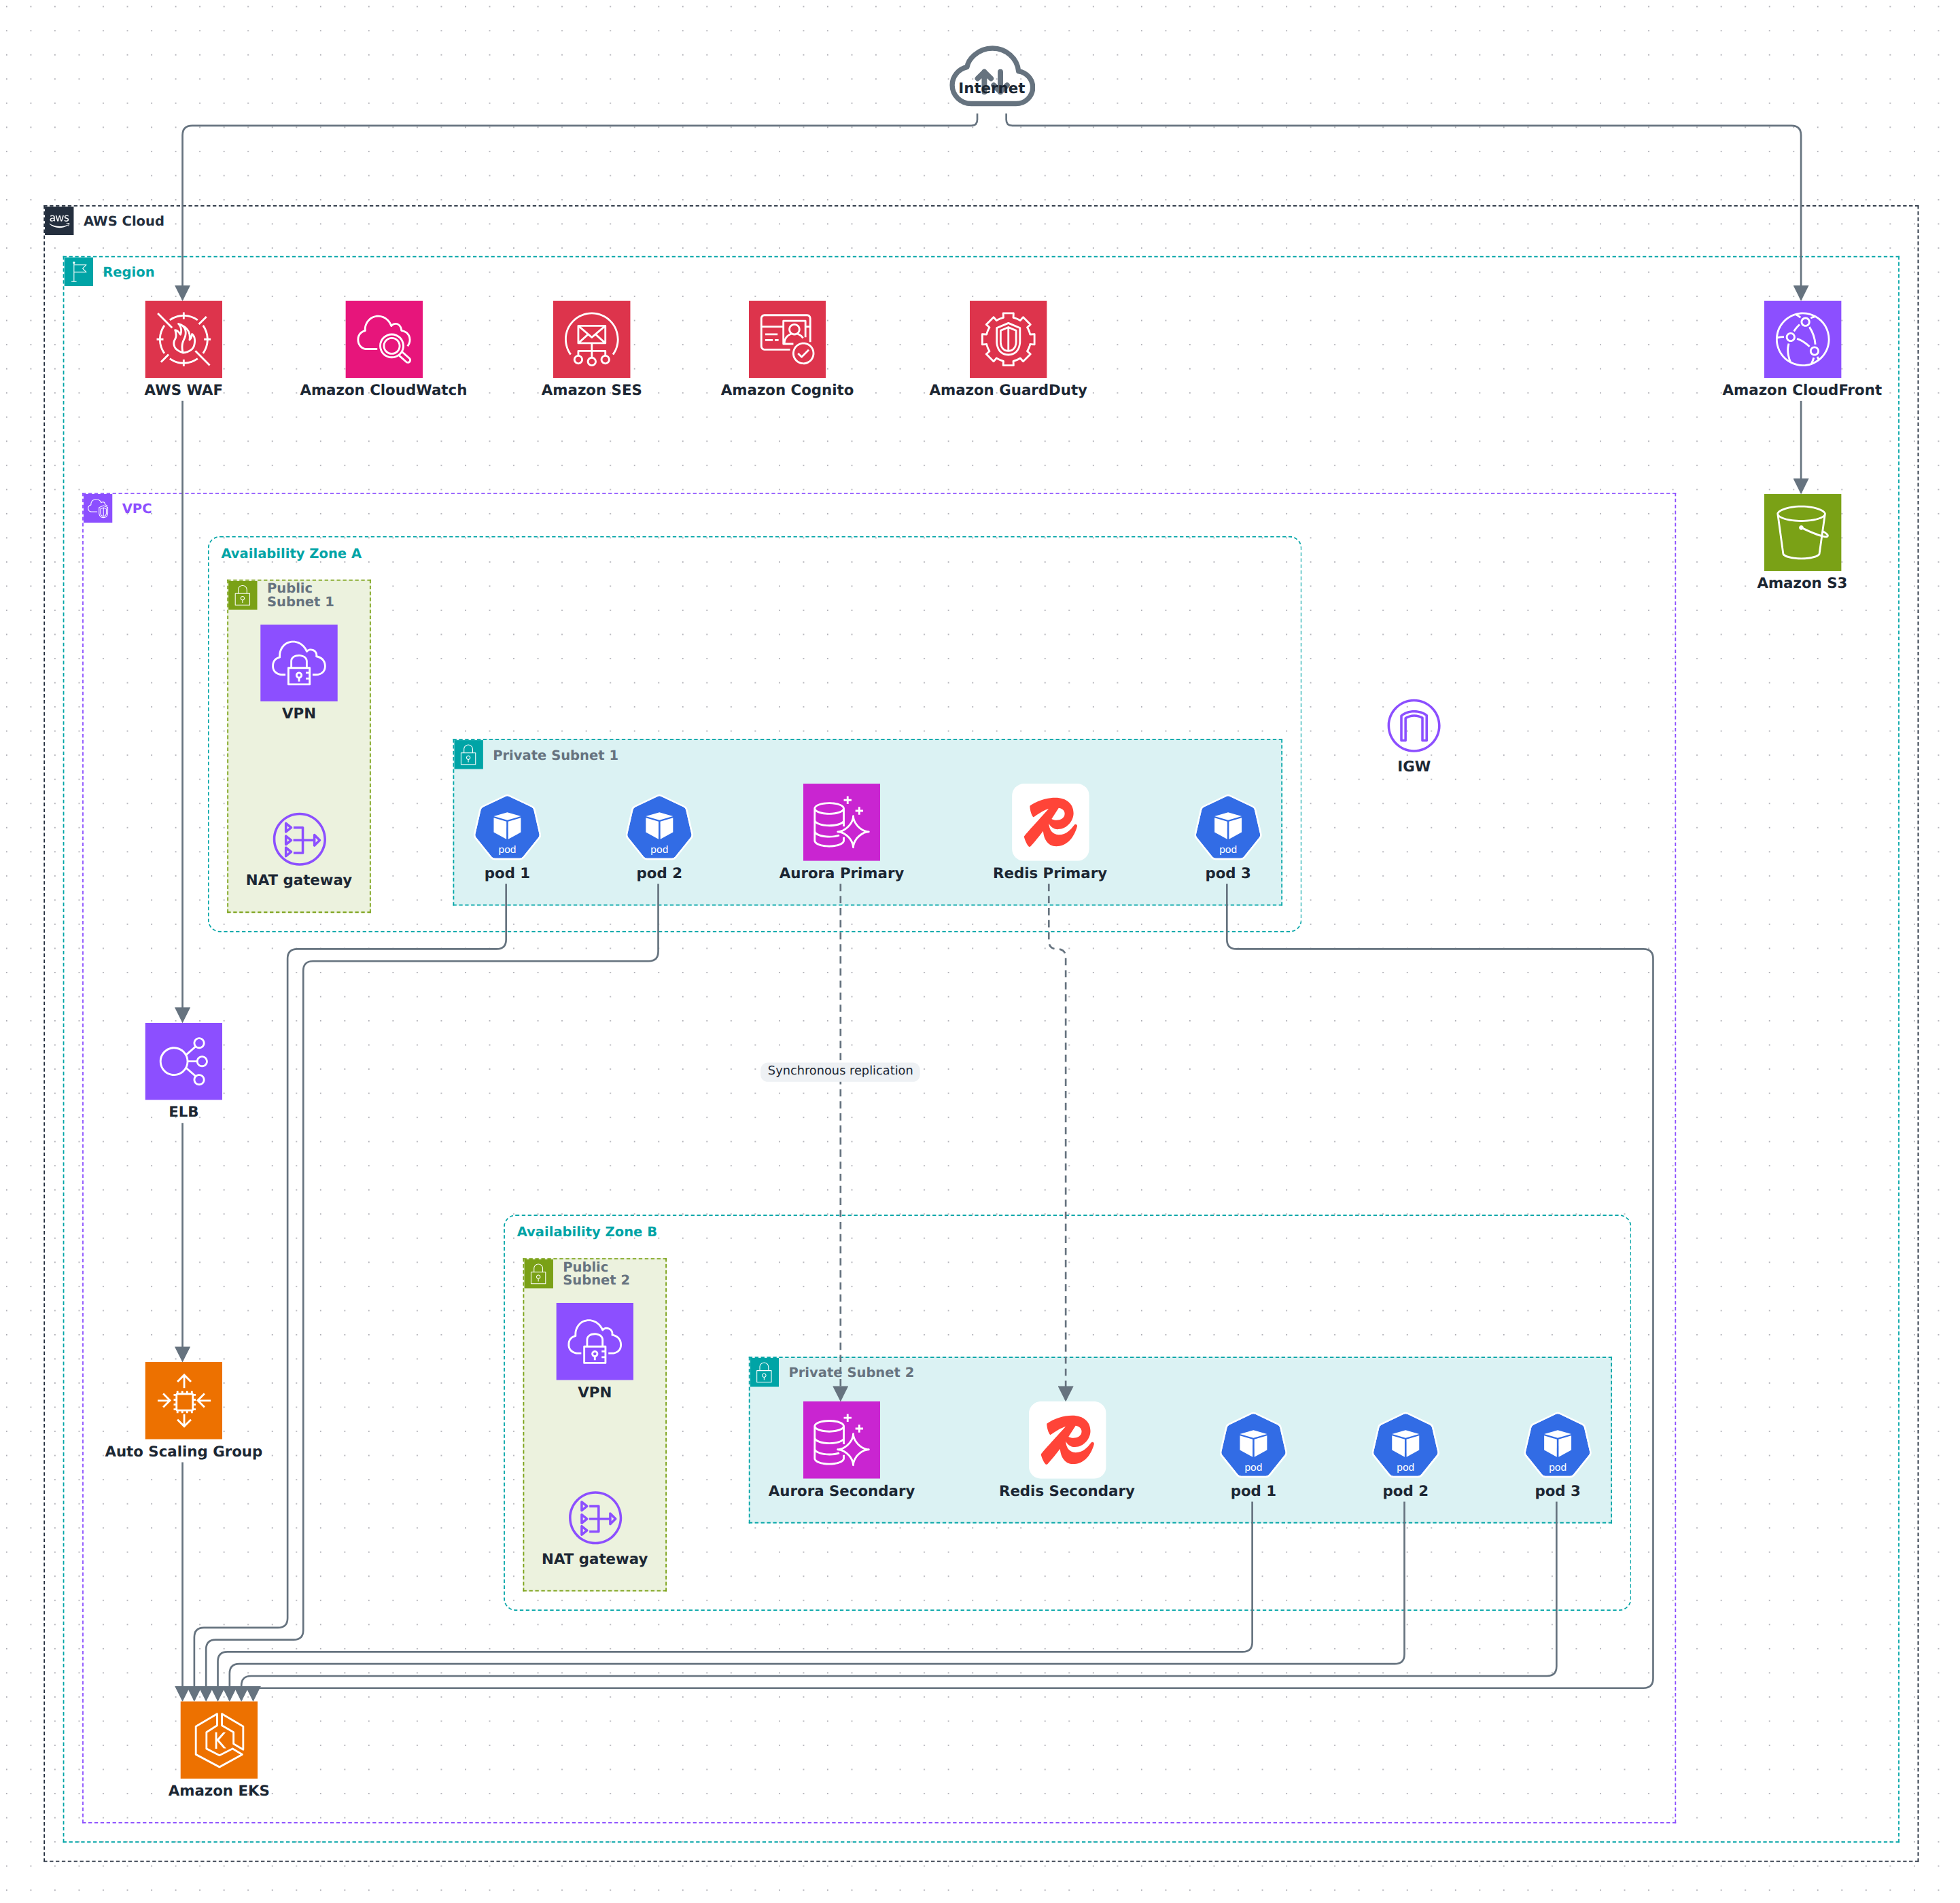
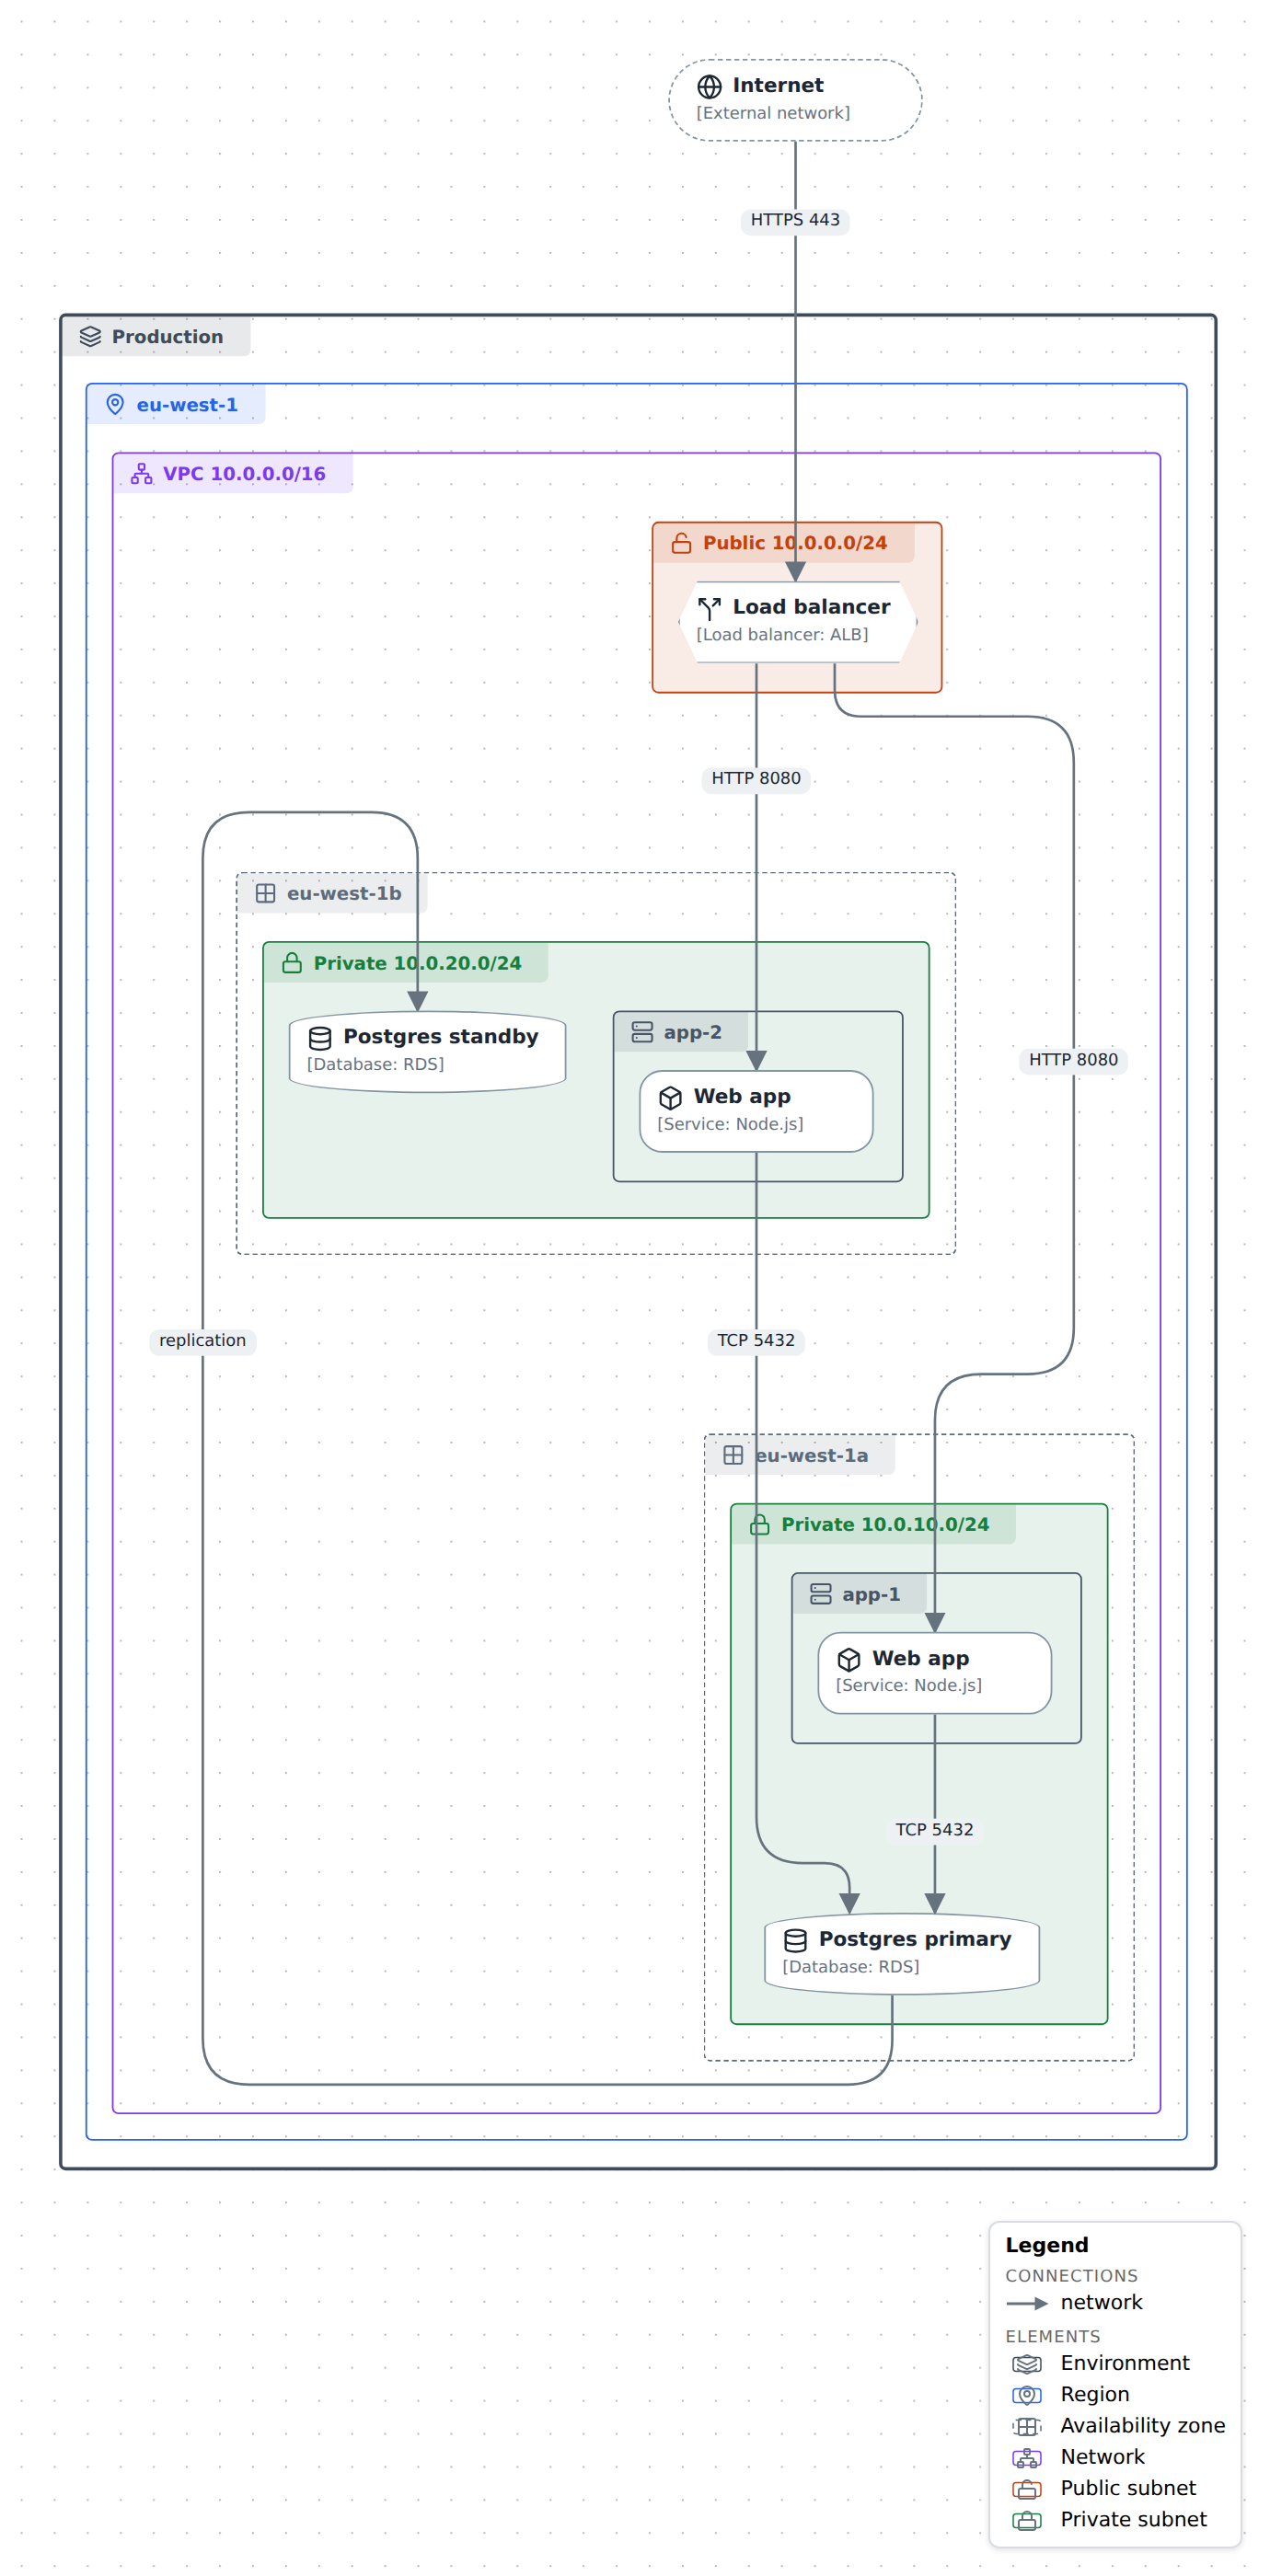
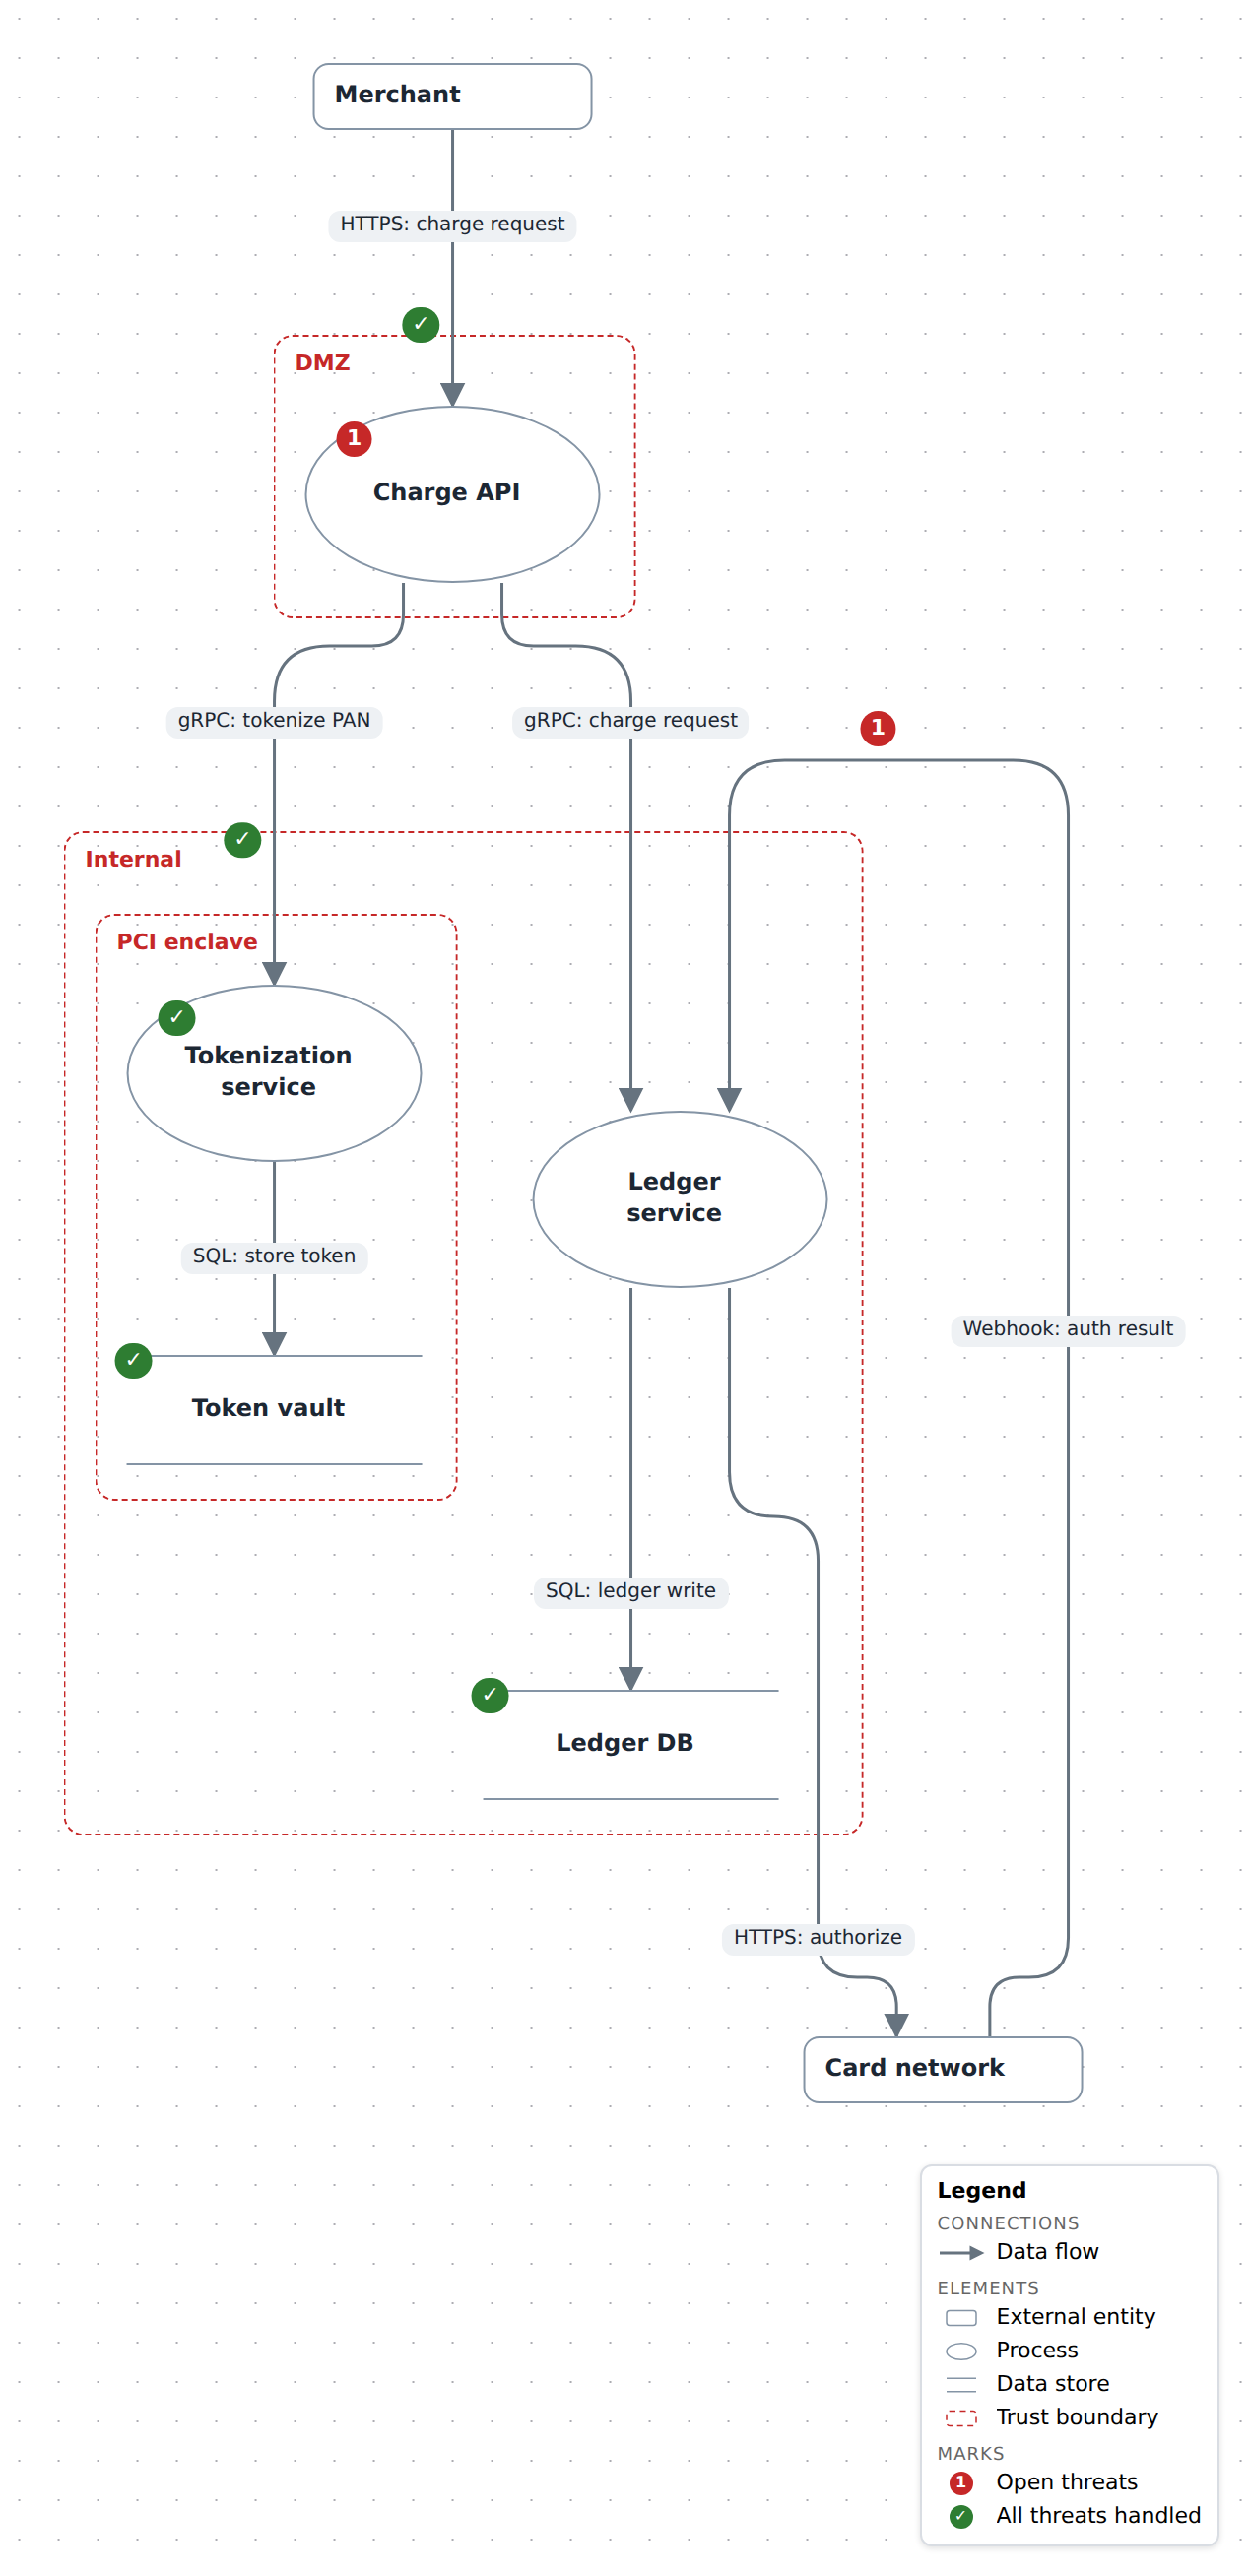
C4, deployment, ER, activity, threat model, causal loop, plan, fishbone, git graph and second-order thinking. Each has a starter to copy.

Examples of every type

Icon libraries

C4 stencils and the AWS, Azure, Google Cloud, Kubernetes and tech icon sets. Import your own images too.

Use the icon library

Diffs for review

diagc diff draws what changed between two git refs. A GitHub Action puts the before and after pictures on a pull request.

Show what changed

Notes on the picture

A legend, comments and links on any node or relation, and freehand drawing on top of the boxes.

Comment on a diagram

Obsidian

A plugin puts the studio and diagram embeds in a vault, and links a node to a note. It is built from a checkout of this repository.

Use the Obsidian plugin

How it works

  1. Write or draw

    A diagram is a .diagram.ts file under .diagrams/src/. Or draw it in the studio, which writes a .diagram.json. Positions go to a separate .layout.json, so meaning and coordinates land in different diffs.

  2. Compile and validate

    diagc compile checks each source and writes one validated model per diagram. Both ways of authoring meet at that model.

  3. Look, then publish

    diagc studio shows the result and recompiles as you edit. diagc publish writes the HTML pages and the PNGs.

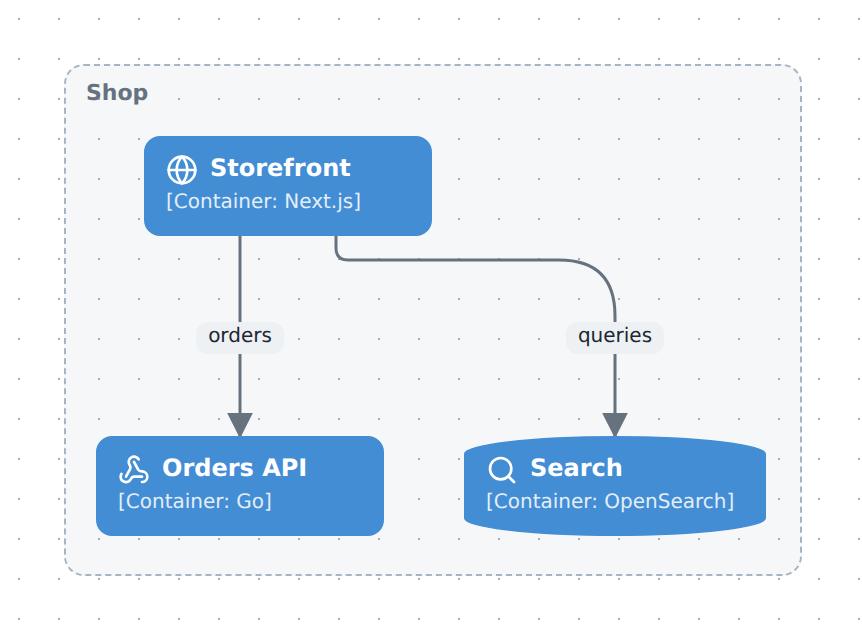
.diagrams/src/shop.diagram.ts
import { model } from '@diagc/core';

// A starter: a customer and one system holding two services and a database.
// `contains` nests, `relate` draws an arrow. The system rests folded, with the
// arrows into it bundled, until you double-click it.
const m = model('shop', { name: 'Shop' });

const customer = m.node('customer', { type: 'person', name: 'Customer' });
const shop = m.node('shop', { type: 'system', name: 'Shop' });

const web = m.node('web', { type: 'service', name: 'Storefront' });
const api = m.node('api', { type: 'service', name: 'Orders API' });
const db = m.node('orders-db', { type: 'database', name: 'Orders DB' });

shop.contains(web, api, db);

m.relate(customer, web, { kind: 'sync', label: 'Browses' });
m.relate(web, api, { kind: 'sync', label: 'Places orders' });
m.relate(api, db, { kind: 'writes', label: 'Order rows' });

export default m;
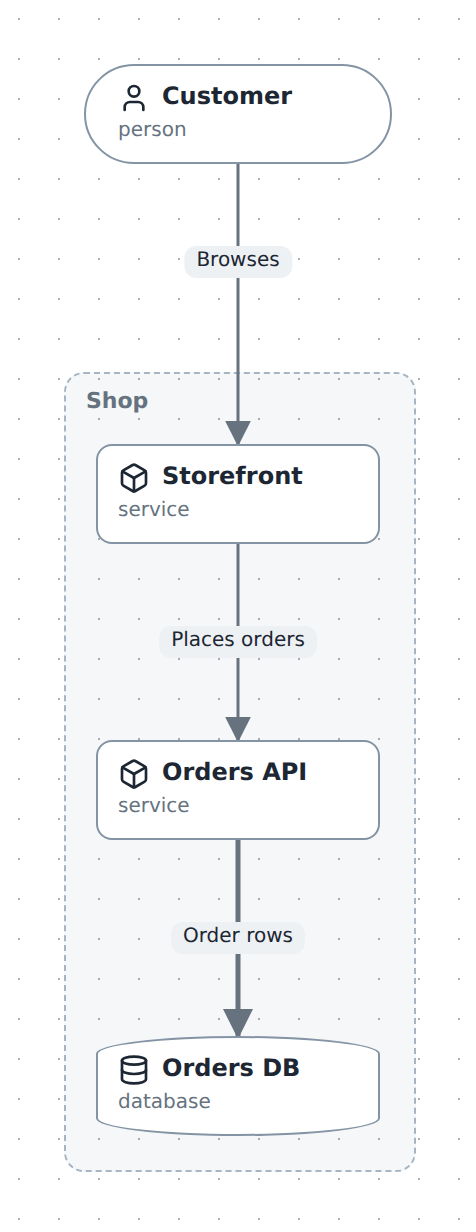
The diagram that source draws: a customer, and a shop holding a storefront, an orders API and a database
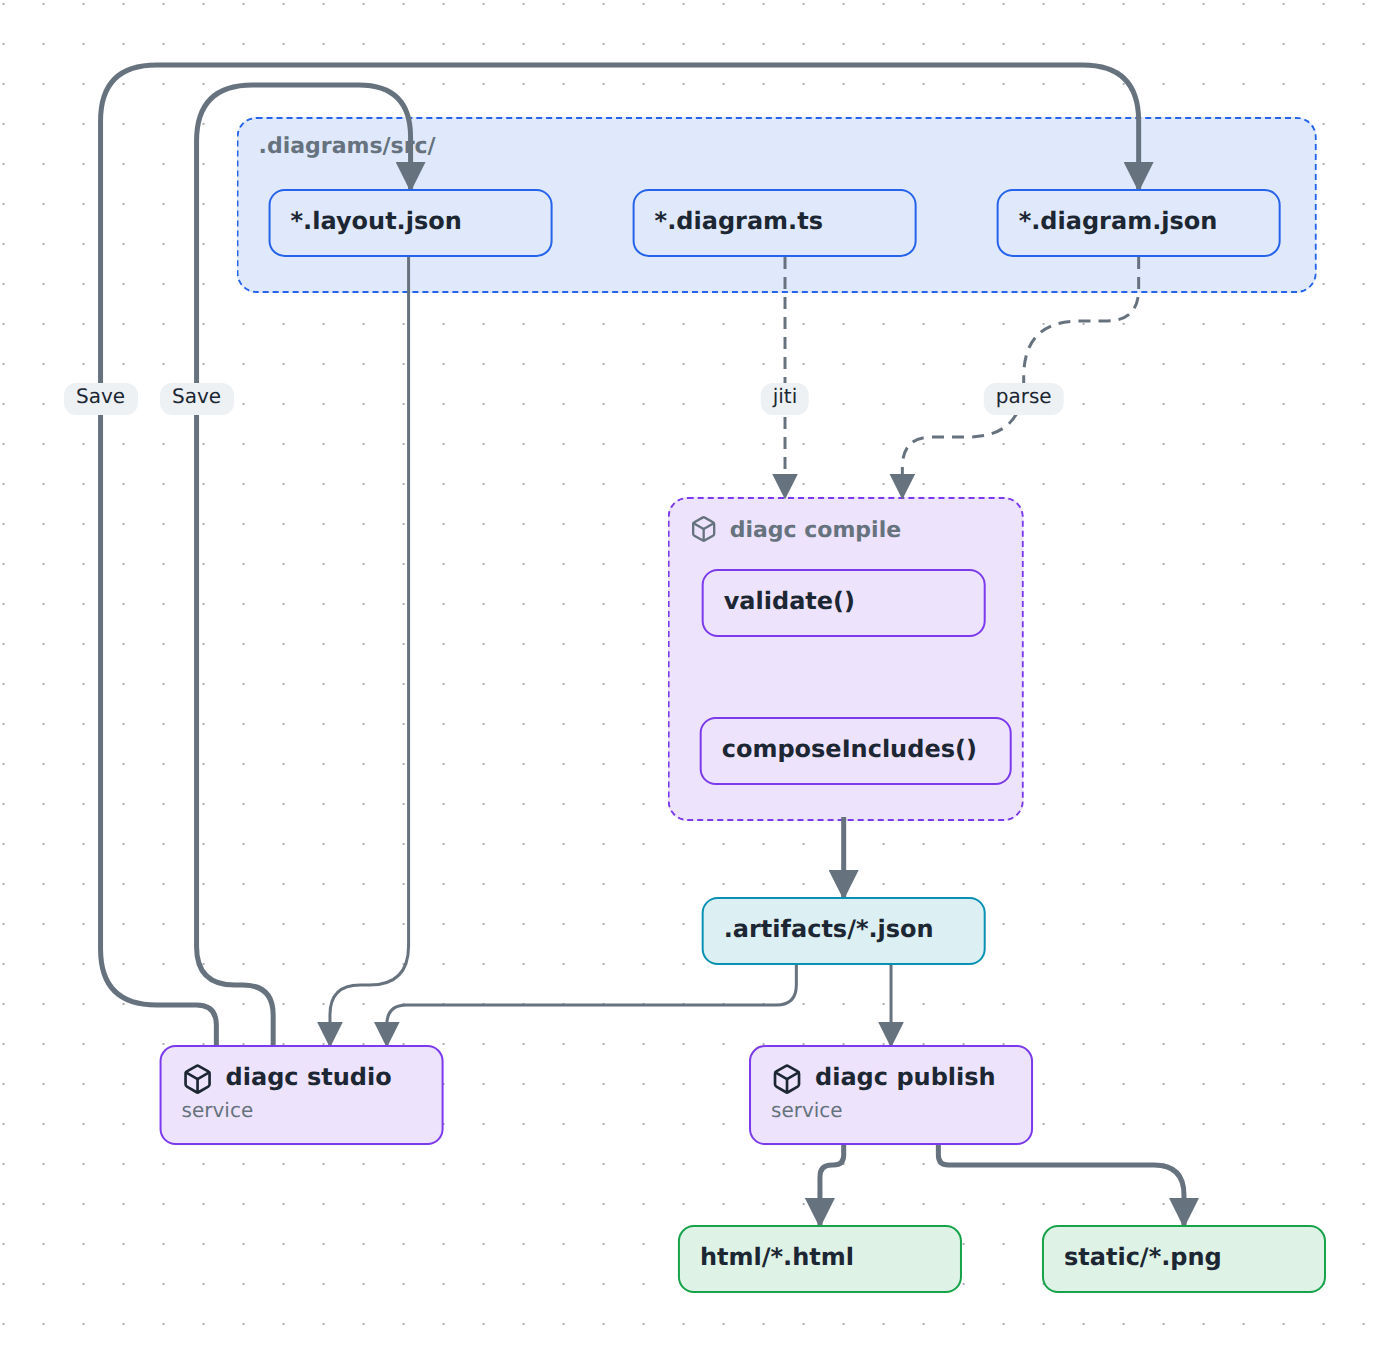
The pipeline: TypeScript and JSON sources are validated into one model, which the studio and publish both read
The pipeline, drawn with diagc. How a diagram becomes a picture

Demos

Each one is a page that diagc publish wrote. Double-click a group to open it, scroll to pan, pinch to zoom.

All examples

Docs

Tutorials

Learn by doing. Zero to a compiled, rendered, exported diagram.

Your first diagram

How-to guides

One task each: a diagram type, planes and layers, publishing, a coding agent.

All how-to guides

Reference

The CLI, the model, the builder API, the studio and the icon library.

Reference pages

Explanation

The pipeline, the model, and why a view is not what is stored.

Explanation pages

For a model with no shell to run diagc guide in, the whole guide is one file: llms.txt.

All documentation