Draw a causal-loop diagram
Show how a handful of variables push each other around in circles. Every link is signed — + when the two move the same way, − when they move opposite ways — and every closed ring of links is a feedback loop: reinforcing (it runs away), balancing (it settles), or unclassified where a link in it carries no sign. Reach for one when the interesting thing about a system is that its effects come back round.
In the studio
- Create a new JSON diagram, press Edit, and in Layers & planes set its Notation to Causal loop.
- Double-click empty canvas to drop a variable and name it. Leave it typeless — the notation draws a typeless node as a bare text chip, which is what a variable should look like.
- Select a variable and press
Tab, or click the+on it, to add a connected variable and start naming it. (A variable that groups others offers neither+norTab; an open group draws as a bare name tag rather than a box.) - Or drag from a variable's connect dot to another one, to draw the link by itself.
- Select a link. Its Properties panel carries two rows this notation adds: Polarity (
∅,+,−) and Delay (·,‖). Polarity colours the whole link — green for+, red for−— and prints its sign near the arrow head; a delay draws two hash marks across the middle of the line. - The Style section gains two more rows here: Curvature, which deepens or flattens the bow, and Flip curve, which moves the bulge to the other side of the line, arrow direction unchanged.
A link's kind is free-form and the loop maths never reads it, so the sync a connect gesture leaves behind works as well as anything; the two examples below write influence.
↻ in the corner controls hides and shows the R/B badges, which pile up once a graph is dense. Click a badge to make its loop glow and dim the rest; click it again to let go. In view mode, selecting a variable narrows the badges to the loops that variable is in, and the left dock becomes Leverage: the loops it sits in, the upstream drivers that reach it with the net sign of each shortest path, and the variables that recur across its loops. Ctrl/Cmd + click a second variable adds a Dependency section reading the two against each other. That panel is the studio's — a published page gets the badges, not the analysis.
From TypeScript
import { model } from '@diagc/core';

const m = model('word-of-mouth-growth', { name: 'Word-of-mouth growth' });
m.notation('causal-loop');

const users = m.node('users', { name: 'Active users' });
const word = m.node('word-of-mouth', { name: 'Word of mouth' });
const signups = m.node('signups', { name: 'New sign-ups' });

// Every link is '+', so nothing cancels and the loop reinforces: the renderer
// badges it R.
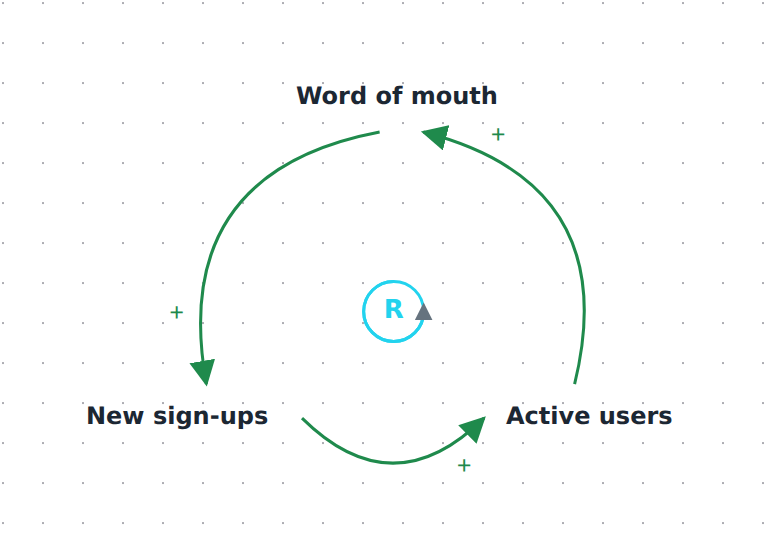
m.relate(users, word, { kind: 'influence', polarity: '+' });
m.relate(word, signups, { kind: 'influence', polarity: '+' });
m.relate(signups, users, { kind: 'influence', polarity: '+' });

export default m;
There is no builder for this notation and it needs none: m.notation('causal-loop') to declare it, plain typeless m.nodes for the variables, and m.relate carrying polarity. Sign every link — one unsigned link is enough to leave its whole loop unclassified. delay: true marks a link whose effect arrives much later. polarity outside + and - fails validation with invalid-polarity, and a non-boolean delay with invalid-delay.
A causal-loop plane is laid out with elk's stress algorithm by default, not layered: stress places variables by how far apart they are in the graph, so a feedback loop comes out as a ring rather than a line with one edge running back up it. Boxes that land on each other are then pushed apart. Pick another algorithm in Layout & style if you prefer one; layered is stored by name on this notation, since it is not the default here. A dense diagram with many loops still reads better hand-placed: Alt-drag the variables where you want them and press Save positions — see Place boxes on a generated diagram. Both examples below carry a <name>.layout.json holding their positions.
How the loops are found and labelled
Loops are worked out from the arrows actually drawn, every time the view changes — so a layer you switch off, or a plane that leaves a variable out, changes the badges the way it changes the picture. Relations running in the same direction between two variables collapse into one signed link first, and count as unsigned if they disagree about polarity. A pair running opposite ways stays two links — which is what lets two variables form a loop at all.
R or B is the sign rule. Count the − links around the loop. An even number — none included — makes the signs cancel, and the loop reinforces: R, in cyan. An odd number makes it balance: B, in magenta. If any link in the loop carries no polarity, the loop is ? in a dashed circle — unknown, not neutral.
The badge sits just off the top-right corner of the loop's first variable (the lowest of its ids in sort order), nudged outward along rings until it clears the boxes and the badges already placed. That rule is worth knowing when you place variables by hand: a badge lands inside its ring when the loop's lowest-id variable sits at the ring's bottom left. The small arrow on it is the loop's winding on screen, read off the polygon its variables make; a two-variable loop, a loop whose variables are collinear, and a ? get no arrow. Loops are listed shortest first — at most 20 variables long, 50 badges at a time.
A delay is two hash marks across the middle of the link. It changes nothing about R and B: it is a note to the reader that this effect arrives late, which is usually why a balancing loop overshoots instead of settling.
Leverage, the studio panel above, is the other half of the reading, and it is structural only — a causal-loop diagram carries no numbers, so nothing is simulated. A driver's sign is the polarities multiplied along its shortest path to the selected variable: ± where two shortest paths disagree, ? where one crosses an unsigned link.
When to reach for something else
- Second-order thinking — what follows from one decision, forward in time. A cycle there is an error (
so-cycle); this notation is where a cycle belongs. - Fishbone — the causes of one effect, as a one-way tree. No feedback, and the shape is the notation's own.
Examples
Starter — the listing under From TypeScript is the whole file: three variables and one all-positive ring — the smallest ring worth drawing. Copy it into .diagrams/src/ and change the names. Source
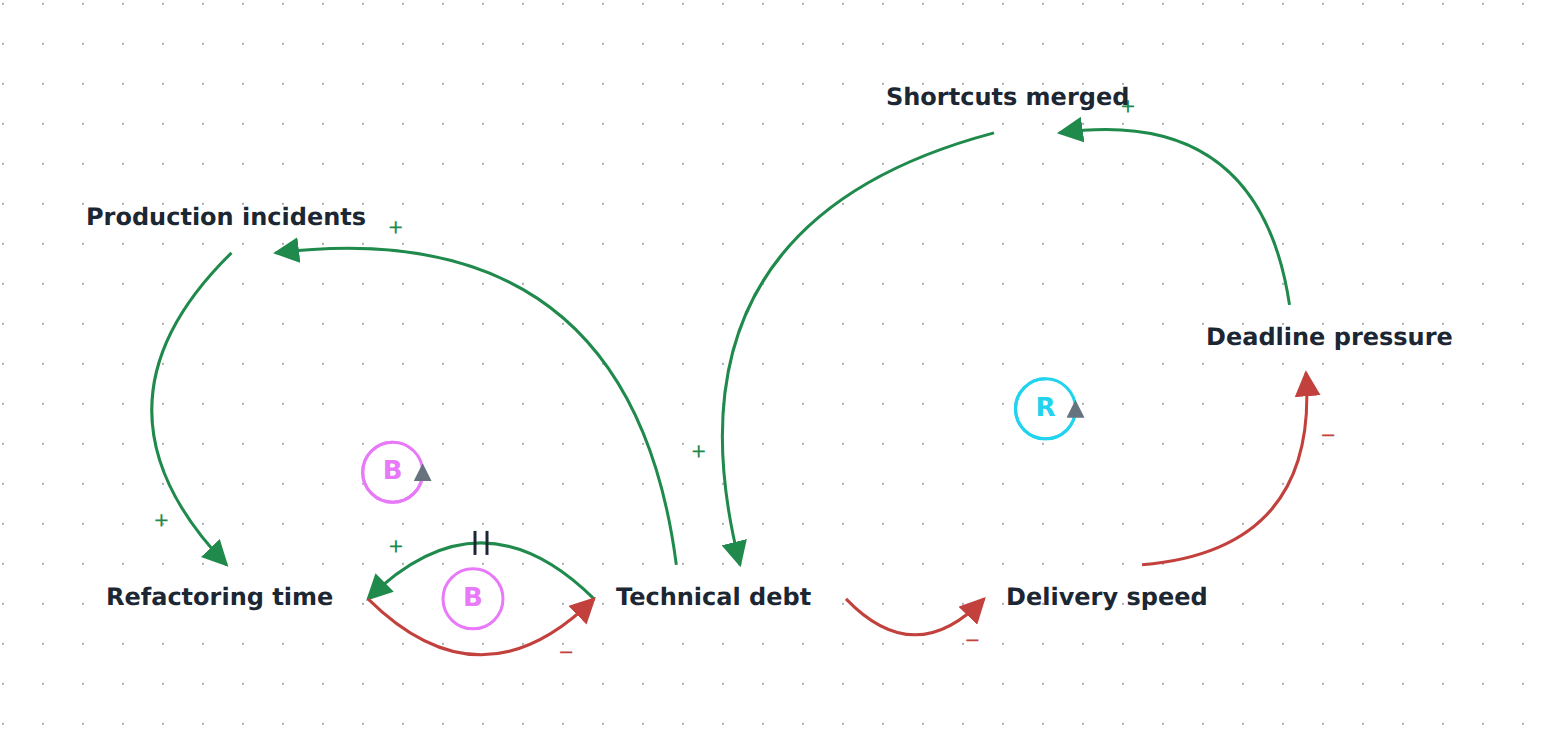
Technical debt: the shortcut spiral — a codebase everyone agrees should be cleaned up, and why it stays dirty: the spiral that deadline pressure feeds, and the two loops that keep it from running away entirely. Six typeless nodes and eight m.relate calls under m.notation('causal-loop'), with mixed polarities and a delay on the cleanup that is planned rather than forced. Source
See also
- Builder API —
m.notation,m.node, andm.relate'spolarityanddelay - Model reference — the causal-loop conventions, what a relation stores, and the validation codes
- Draw a second-order thinking diagram — the consequences of a decision, where a loop is an error
- Author diagrams in TypeScript — the rest of the
.diagram.tsrecipes