Draw a deployment diagram
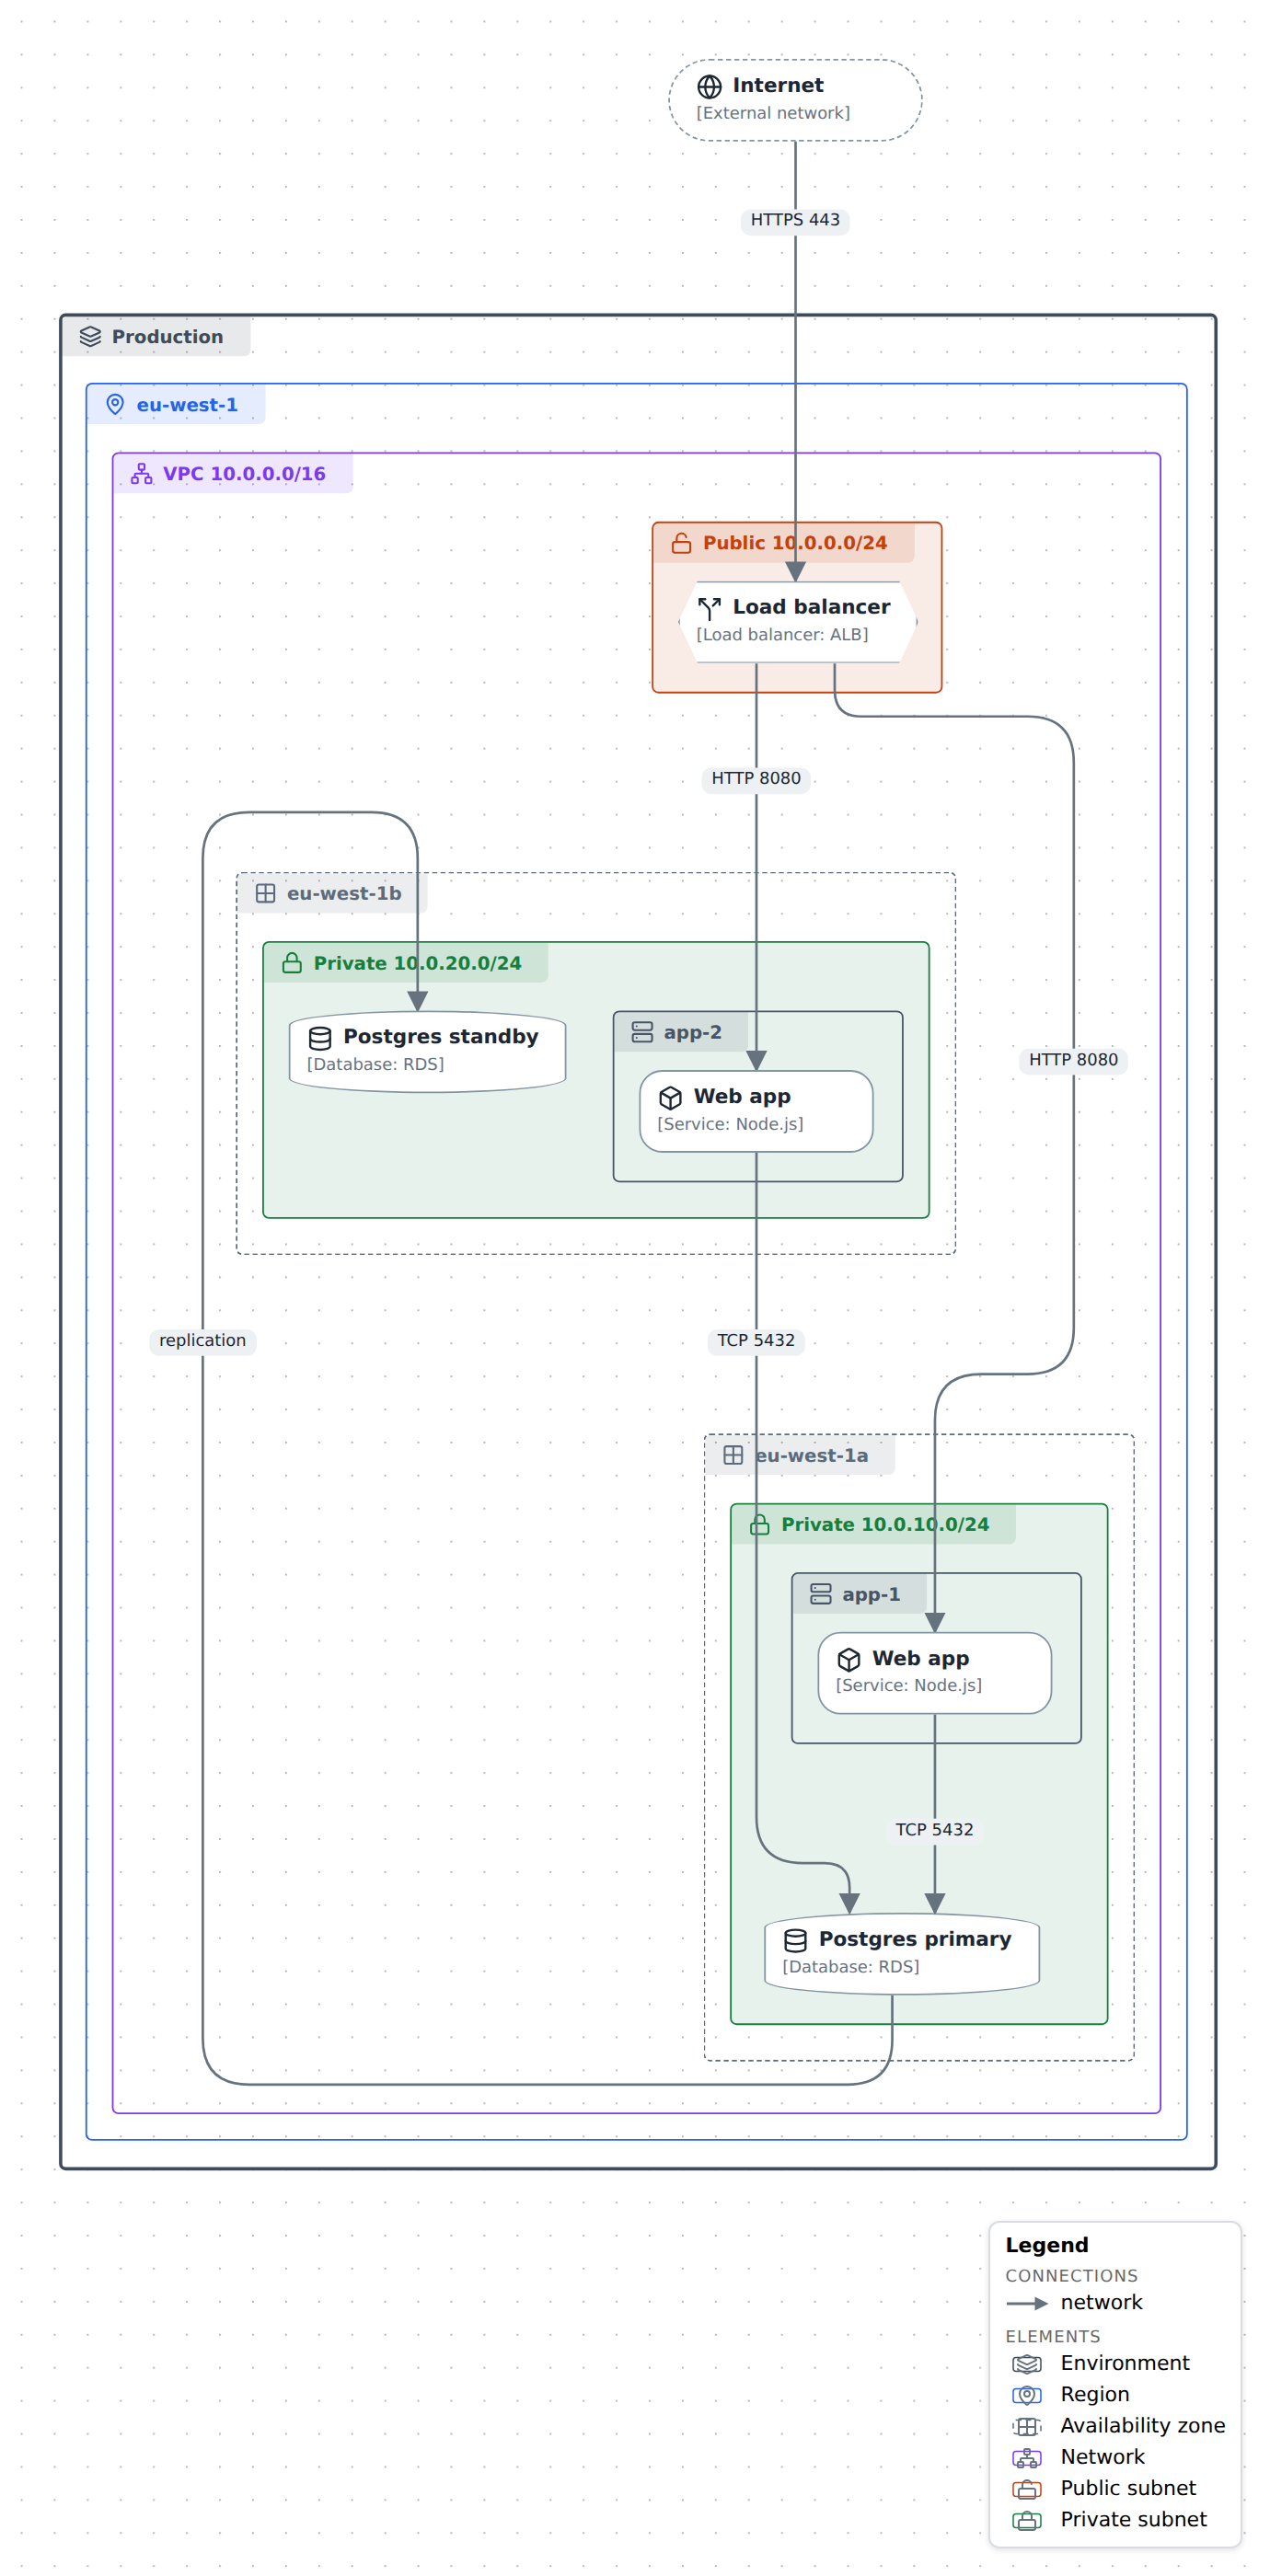
Where the software runs: the environments, regions, availability zones, networks and subnets around it, and the hosts, services, databases and load balancers inside those. What a box sits inside is the information — a private subnet says how it is reached, an availability zone what it fails with — so zones are containers, and the deployment notation gives each kind its own colour and a header tab.
In the studio
- Create a new JSON diagram and, in Layers & planes, set its Notation to Deployment.
- In the Library tab's Deployment section, drag out the zones — Environment, Region, Availability zone, Network, Public subnet, Private subnet, Cluster, Host — and the nodes that go in them: Service, Database, Queue, Storage, Load balancer, Gateway, Firewall, External network. A dropped zone is an empty box.
- Put a node inside a zone from the node's own panel: Memberships → Choose parent… → the zone → Add. Zones nest the same way. Dragging a box into a zone only moves it; the picker is what changes containment.
- Drag from a connect dot to another node to draw a connection, and give it a label: the port or protocol is usually what a reader wants from the line.
From TypeScript
There is no special builder: every element is an m.node with a deploy-* type, and contains builds the zones.
import { model } from '@diagc/core';

const m = model('deployment-starter', { name: 'Two-subnet VPC' });
m.notation('deployment');

const internet = m.node('internet', { name: 'Internet', type: 'deploy-internet' });
const lb = m.node('lb', { name: 'Load balancer', type: 'deploy-load-balancer' });
const app = m.node('app', { name: 'API', type: 'deploy-service', technology: 'Go' });
const db = m.node('db', { name: 'Orders DB', type: 'deploy-database', technology: 'Postgres' });

const pub = m.node('public', { name: 'Public', type: 'deploy-subnet-public' }).contains(lb);
const priv = m.node('private', { name: 'Private', type: 'deploy-subnet-private' }).contains(app, db);
m.node('vpc', { name: 'VPC', type: 'deploy-network' }).contains(pub, priv);

m.relate(internet, lb, { kind: 'network', label: 'HTTPS 443' });
m.relate(lb, app, { kind: 'network', label: 'HTTP 8080' });
m.relate(app, db, { kind: 'network', label: 'TCP 5432' });

export default m;
The full example at the top of this page is .diagrams/src/examples/deployment/web-app.diagram.ts: two availability zones, a host per zone with the service inside it, and a replicated database.
The vocabulary
| Type | Look on this notation |
|---|---|
deploy-environment |
solid, heavier outline and tab in slate |
deploy-region |
solid outline and tab in blue |
deploy-zone |
dashed outline and tab in grey — an availability zone or any other failure domain |
deploy-network |
solid outline and tab in violet — a VPC, a VNet, a LAN |
deploy-subnet-public |
amber wash, outline and tab |
deploy-subnet-private |
green wash, outline and tab |
deploy-cluster |
dashed outline and tab in teal |
deploy-host |
solid outline and tab in grey; a leaf when its workloads are not drawn |
deploy-service, deploy-database, deploy-queue, deploy-storage |
rounded box, cylinder, pill, cylinder |
deploy-load-balancer, deploy-gateway |
hexagon |
deploy-firewall |
box |
deploy-internet |
dashed pill — the internet, or any network you do not own |
Each type prints its own subtitle ([Database]), and technology joins it: [Database: Postgres]. A zone's header shows only its icon and name, so the legend names the zones for you.
The colours are theme tokens: they lift in the dark theme. A node's own color still wins over its zone colour.
C4's Deployment Node (c4-deployment-node) draws as a host on this notation, so a C4 deployment diagram can switch to it and keep its types.
Related
- Draw a C4 diagram — the software the deployment runs.
- Use the icon library — the AWS group stencils, for a diagram that should look like AWS's own.
- Add a legend