Draw an ER diagram
Show a schema the way it is keyed: every table a titled box listing its columns and their types, primary and foreign keys marked, and every foreign key an edge from the referencing column to the column it references — row to row wherever the two tables face each other side to side. There is no notation to switch on — an ER diagram is ordinary nodes of type db-table joined by fk relations, so it shares a canvas with anything else you draw.
In the studio
Editing needs a JSON diagram: one compiled from .diagram.ts opens read-only.
- Press Edit in the top bar.
- In the Library tab, find the Data section — or type
erdin the search box. It holds one entry, Table. - Click the card to drop a table at an auto-placed spot, or drag it where you want it. Either way it arrives seeded with one
id int PKrow. - Type its name: a dropped table opens with its title ready to edit, and
Entercommits it. Double-click the title to rename it later. - Click a row to edit it in place.
- A row reads, left to right: a badge that cycles none → PK → FK, the column name, and its type. ↑ and ↓ move it, ✕ removes it, and + add column at the foot appends one. The type field suggests
uuid,int,bigint,text,varchar,bool,timestamp,timestamptz,jsonbandnumeric, and keeps anything else you type. - Drag from a row's connect point — on the row's right edge — onto another table. That makes an
fkrelation from that column to the target's primary key, and flags the columnFKif it was not flagged already.
The rows are inert outside edit mode, and the per-row connect points are hidden there, so a published page or a PNG shows the table without the editing chrome.
From TypeScript
import { model } from '@diagc/core';

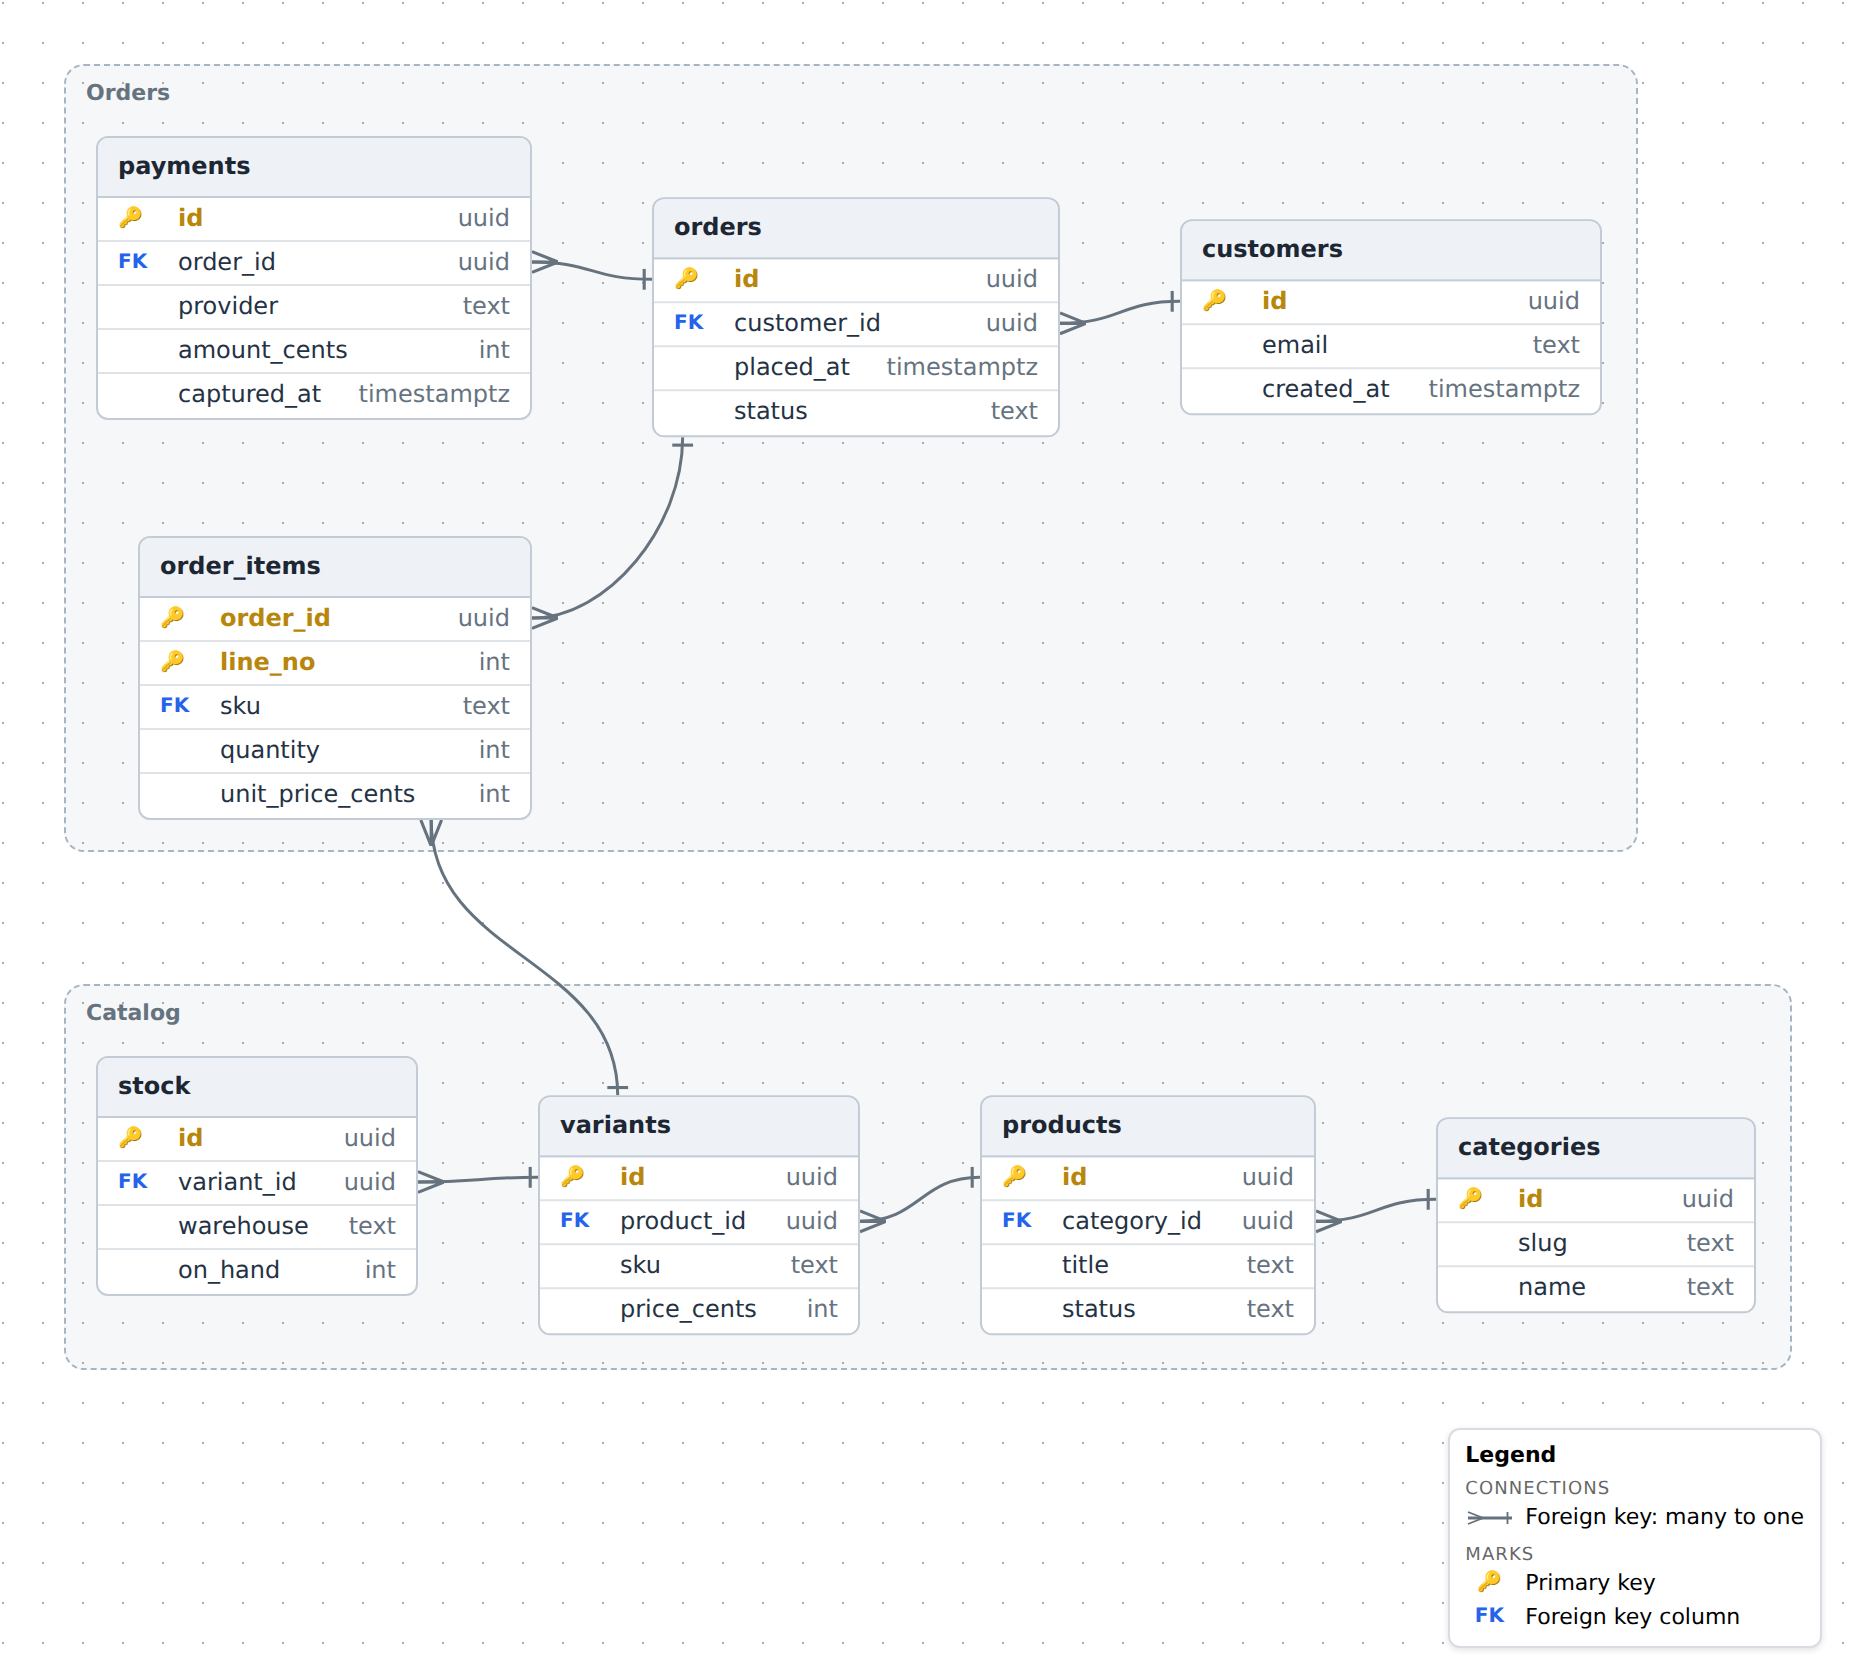
const m = model('library-loans', { name: 'Library loans' });

const members = m.table('members', {
  columns: [
    { name: 'id', type: 'uuid', pk: true },
    { name: 'email', type: 'text' },
    { name: 'joined_on', type: 'date' },
  ],
});

const loans = m.table('loans', {
  columns: [
    { name: 'id', type: 'uuid', pk: true },
    { name: 'member_id', type: 'uuid', fk: true },
    { name: 'due_on', type: 'date' },
  ],
});

m.fk(loans, 'member_id', members);

export default m;
m.table(id, opts) is m.node(id, { type: 'db-table', ...opts }) with columns made required. A column is a name plus an optional type, pk and fk; type is free text, so date, numeric(10,2) or citext are all fine. Everything else a node takes — name, color, description, metadata — still applies.
m.fk(from, fromColumn, to, toColumn?) is a kind: 'fk' relation carrying both column names. Leave toColumn out and it resolves to the target's single primary-key column — which means the target table must already be declared, with exactly one pk, or the call throws. Name the column when that does not hold, or when the key points somewhere other than the primary key — as the shop schema below does, where an order line references a variant by its SKU:
m.fk(orderItems, 'sku', variants, 'sku');
Marking the column fk: true is separate from drawing the edge: the flag is what prints the FK marker on the row, and m.fk does not set it for you.
Put a column on a layer
A column can carry a layer, like a node. The row is drawn only while that layer is on, which suits a proposed column or a group of audit fields that most readers can skip:
m.layer('proposal', { name: 'Proposed' });

const events = m.table('booking_event', {
  columns: [
    { name: 'id', type: 'uuid', pk: true },
    { name: 'flag', type: 'text', layer: 'proposal' },
  ],
});
The table keeps its place with the layer off; it only loses the row, and its height shrinks to match. The layer gets a legend row that switches it. An fk edge whose column is hidden floats to the table's middle, so tag the relation with the same layer: m.fk(events, 'owner_id', users, undefined, { layer: 'proposal' }).
How a table is drawn
A db-table node draws as a header plus one row per column instead of a shape. The header is the node's name; each row is a marker, the column name, and the type right-aligned. pk prints a 🔑 and sets the name in the key colour, fk prints FK, and a column with neither leaves that space blank.
The box is sized from the text rather than measured in the browser: 30 px of header plus 22 px per row, and a width that fits the widest row — or the title, whichever is wider — clamped to 160–340 px. That footprint is what the layout engine is given, so tables are laid out at full size instead of collapsing into default boxes.
An fk edge is pinned to its two rows: each end keeps the x of the border it faces and takes the y of the column's row. That only works on a left or right border — when the layout stacks one table above another, the edge leaves the top or bottom and floats to the box's middle like any other relation. A column name that matches nothing is ignored by the renderer rather than failing, but validate() still reports it as unknown-column, and the compiler writes no artifact while it does. The referenced end falls back to the target's first primary-key column when the relation names no toColumn, and the fk kind draws a bar there and a crow's foot at the referencing end — many rows to one.
The crow's foot, the 🔑 and the FK tag are keyed in the legend, which ▤ brings up whether or not the file declares one. Call m.legend() to have it start shown and travel into the PNG; see Add a legend.
Tables are ordinary nodes, so ordinary containment groups them — the shop schema above puts its catalog and its orders in two boxes — and such a group folds and unfolds like any other.
When to reach for something else
- C4 — which service owns which store, not which column points where. A
databaseortablenode says "there is a store here" without the columns. - Threat model — where the data crosses a trust boundary.
.threat()works on a table ref too, so an ER diagram can be threat-modelled where it stands.
Examples
Starter — the listing under From TypeScript is the whole file: two tables, a primary key on each, and one foreign key that resolves its target column by itself. Copy it into .diagrams/src/ and change the names. Source
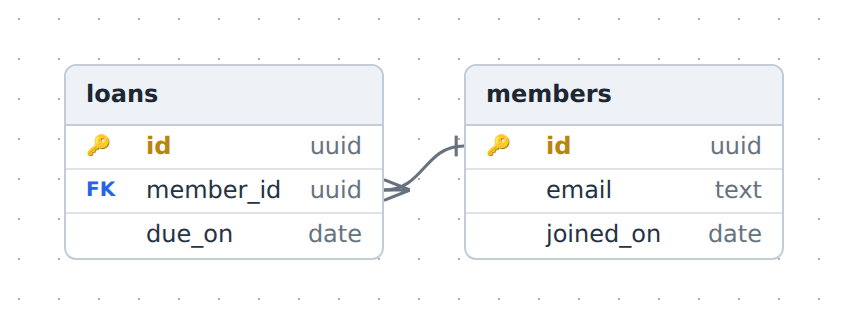
Shop schema — a shop's eight tables, grouped into a catalog half and an orders half that a single foreign key crosses. It shows a composite primary key on the order lines, a key that names its target column instead of resolving to a primary key, and types on every column. Source
See also
- Builder API —
table,fk - Model reference — the ER conventions,
Column,fromColumn/toColumn, and theduplicate-column,invalid-columnsandunknown-columnvalidation codes - Library reference — the Data pack's one stencil
- Author diagrams in TypeScript — the rest of the builder